Summary of June PCE, July 30, 2026
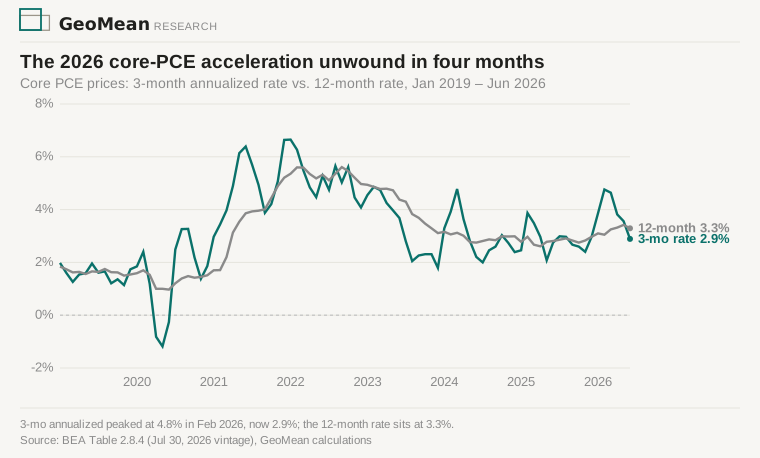
- Core PCE rose 0.1 percent in June, the softest month since March 2025; the 3-month annualized rate fell to 2.9 percent, below 3 for the first time since December.
- The headline index fell 0.1 percent — its first monthly decline since April 2020 — on a 9.2 percent gasoline drop; the 12-month rate eased to 3.7 percent from 4.1.
- Financial services’ swing from +1.3 to +0.2 drove about half the core slowdown, but core cooled without it, and market-based core runs 3.0 percent.
- Real spending rose 0.4 percent for a second month while the saving rate fell to 2.7 percent, the lowest since June 2022 — no sign the policy rate is restraining demand.
- Core at 3.3 percent over the year is back only to April’s level, and even a string of June-pace months leaves it about 3.0 in September.
| June 2026, PCE | m/m (SA) | y/y |
|---|---|---|
| PCE price index | −0.1% (first decline since Apr 2020) | +3.7% |
| Core PCE (ex food & energy) | +0.1% (softest since Mar 2025) | +3.3% |
| Core PCE, 3-mo annualized | 2.9% (May: 3.6, Feb peak: 4.8) | — |
| Core CPI (same month, for comparison) | 0.0% | +2.6% |
| Real disposable income | +0.3% | — |
| Real PCE (spending) | +0.4% (2nd straight) | — |
| Personal saving rate | 2.7% (lowest since Jun 2022) | — |
On Wednesday, Beth Hammack, Neel Kashkari, and Lorie Logan voted to raise rates. On Thursday morning, the gauge the Fed targets had its softest core month in fifteen months: up 0.1 percent, with the headline index down 0.1 on a 9.2 percent drop in gasoline prices. The 3-month annualized core rate fell to 2.9 percent, from 3.6 in May and a 4.8 peak in February. The 2026 acceleration has unwound to its December starting point.
Six of seven major services categories slowed
Services prices rose 0.1 percent after 0.5 in May, and six of the seven major services categories decelerated. Health care held at 0.3 percent and alone accounted for more than a third of June’s core increase; transportation services, at 0.6 after 0.9, remains the firmest line in the basket. Earlier this month, June CPI showed the same shape from the other basket — a flat core, shelter at its slowest since January 2021. In May both indexes showed services inflation firming; in June both show it fading.
Financial services drove half the slowdown; core cooled without it
The single largest piece of the core deceleration is financial services and insurance, which swung from +1.3 percent in May to +0.2 — a category that has moved between −0.2 and +1.3 across the past five months. Strip it, and core still slowed, to roughly 0.13 percent from 0.23. And market-based core PCE, which drops the prices BEA imputes rather than observes, runs 3.0 percent over the year — below the overall core.
June’s pace still leaves core PCE near 3 percent through fall
Core at 3.3 percent over the year is where April stood; the soft months of late 2025 are dropping out of the 12-month comparison, so the annual rate falls slowly even when the monthly rate doesn’t. Repeat June’s 0.13 percent every month and the annual rate is still about 3.0 in September and 2.7 by December; at a 0.2 pace it stays about 3.1. (The September 30 annual update can move this whole path.)
The saving rate fell to a four-year low with spending still rising
Real spending rose 0.4 percent for the second straight month while the saving rate fell to 2.7 percent — the lowest since June 2022, with May revised down to 2.8 from the 3.0 first reported. Income growth slowed to 0.2 percent from May’s 0.7, though the swing is mostly farm relief payments dropping out; ex-farm, income rose about 0.4 percent again. The same morning’s GDP release put second-quarter growth at 1.5 percent annualized, down from 2.1, with the consumer carrying it. Households are keeping spending growth up by saving less, not by earning more; a 2.7 percent saving rate leaves little room for that to continue if income doesn’t pick up — and it is not the demand weakness that would argue against the dissenters.
Chair Kevin Warsh said Wednesday that five-plus years above target “cannot be cured in nine weeks — or by a single month of modest price decreases.” Thursday delivered exactly that single month — no prophecy required: consensus already expected a soft June, and he was pre-answering a print everyone saw coming. Both June price gauges — CPI two weeks ago, and now the one the Fed targets — came in soft, which favors the patient majority’s pace argument; the level argument the dissenters voted on, core at 3.3 percent with the policy rate barely above it, is untouched. One caution for July: June’s headline decline rode a 9.2 percent gasoline drop, and crude has since returned to about $90 — the next headline number likely reverses. July CPI, on August 12, is the test of whether the services slowing continues.
Since this note was written on July 30: the employment cost index printed 0.9 percent against a 0.8 consensus, and all three dissenters published their reasoning — developments that cut the other way. The August 1 weekly carries that fuller picture.
Sources: BEA, Personal Income and Outlays, June 2026 (PDF) — all income, spending, saving, and price figures; run rates, category detail, and contribution math computed from BEA Tables 2.8.4/2.8.5/2.8.7 (July 30, 2026 vintage, archived with this piece); streak comparisons per BEA’s historical-comparisons table (XLSX); core CPI via our June CPI deep dive and the BLS release; the dissents and Warsh quote via our July FOMC note and the press-conference statement; Q2 GDP via BEA’s advance estimate; the August 12 CPI date per the BLS release schedule. PCE is revised each release; April–May figures reflect this release’s revisions (BLS CES and Medicaid source data).