Summary of June New Residential Construction · July 17, 2026
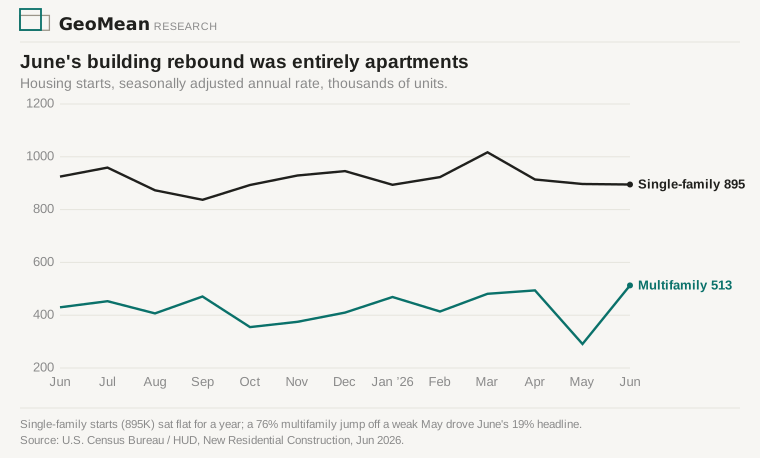
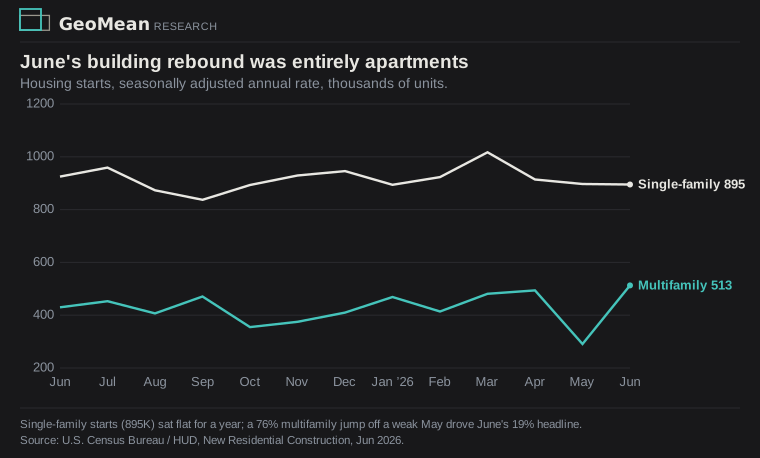
- Housing starts jumped 19.0% in June to a 1.427 million annual pace, but the entire gain was multifamily: apartment starts (buildings with five or more units) rose 76% off a weak May, while single-family starts held at 895,000 — statistically flat against both May’s revised 897,000 and a year ago (Census/HUD).
- Permits, which lead starts, went the other way — down 3.0% for the month and 2.3% on the year. Single-family authorizations (871,000) are back where they sat a year ago. Builders are not ramping up.
- The resale market’s sharp North–South split doesn’t show up in construction. No region’s single-family permits changed by more than the survey’s margin of error from last June — Northeast, Midwest, South, and West all statistically flat.
- What the construction levels show instead is geography: roughly four of every five single-family homes permitted in June were in the South and West, the oversupplied half of the country. The South permits ten single-family homes for every one the Northeast does.
Single-family homebuilding — the new supply that could thaw the resale freeze — is flat nationwide and concentrated in the half of the country that needs it least.
Apartments bounced off a weak May; permits fell
Single-family starts have run between roughly 840,000 and 1,020,000 over the past year and came in at 895,000 in June — inside that band, and statistically flat against both May’s revised 897,000 and last June. Multifamily starts swung from 291,000 in May to 513,000, and that 222,000-unit bounce is the entire headline. The Census Bureau cautions that a starts trend takes six months to establish and a permits trend three; one month of apartment starts, the noisiest series in the release, is neither. Permits lead starts and are revised less — and they fell 3.0% for the month and 2.3% on the year, with single-family authorizations back where they sat a year ago. Builders are not ramping up.
New building skips the North and piles into the South
The resale market splits hard by region — unsold homes across the South, Northern listings selling on contact. Single-family construction doesn’t split; it barely moved anywhere. No region’s single-family permits changed by more than the survey’s margin of error from a year ago — Northeast −1.9%, Midwest +0.8%, South −1.5%, West +3.4%, none distinguishable from flat.
What the levels show is geography, not response. Roughly four of every five single-family homes permitted in June went up in the South and West; one in five in the Northeast and Midwest. For every single-family home the Northeast permitted, the South permitted ten — 52,000 against 513,000 at an annual rate — and the same gap holds for homes actually finished, 66,000 completed in the Northeast against 595,000 in the South. New homes go up where the country has long built them, the South and West, which is now the oversupplied half; almost none go up in the starved North.
New construction is no way out of the split. Almost nothing goes up in the Northeast, where builders were barely active before the split and still aren’t, so the shortage there gets no new supply; what does go up in the South lands on a market already holding more unsold homes than before the pandemic. Neither half of the freeze gets help from new building — not the locked-in Northern owners who won’t list, not the weak Southern demand our inventory work traced. What would change that is a mortgage rate well below today’s 6.5% (Freddie Mac), enough to pull locked-in owners loose. Single-family permits flat in every region say it hasn’t happened.
Sources
Data: U.S. Census Bureau / HUD, Monthly New Residential Construction, June 2026 (Release CB26-119, census.gov) — Tables 1a (permits), 3a (starts), 5a (completions), seasonally adjusted annual rate; regional single-family figures are within the survey’s 90% confidence interval of flat and read here as levels, not significant changes. Mortgage rate: Freddie Mac PMMS. Extracts, the regional/structure table, and the puller script are archived in the GeoMean data files. Builds on the housing inventory divergence deep dive and the June existing-home sales read.