Summary for the Week of July 11, 2026
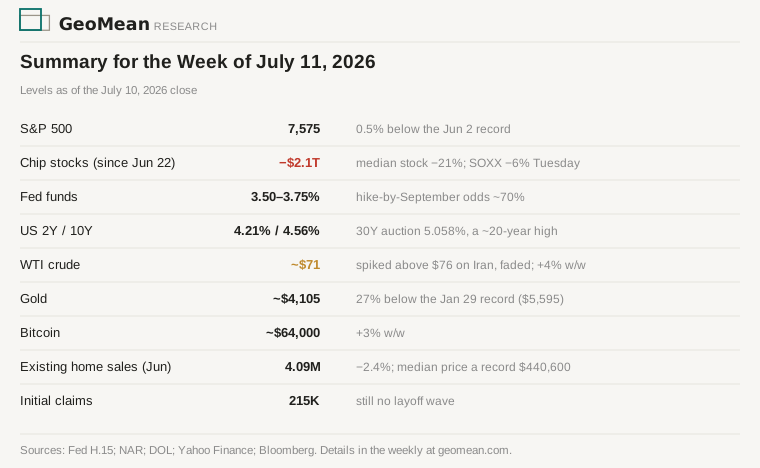
- Chip stocks have shed roughly $2.1 trillion since their June 22 peak — the median chip stock is down 21%, Intel 21% this week alone — while the S&P 500 closed Friday half a percent below its record (Yahoo Finance).
- Investors put the odds of a hike by September near 70% after Wednesday’s minutes, which deliberately scrubbed the easing bias and closed on “The Committee will deliver price stability” (Forbes). Chair Kevin Warsh, after the June meeting: “We’ve missed on inflation for five years and we’re going to fix that” (post-FOMC Q&A).
- Iran ended the ceasefire — the inflation trigger the minutes named — and WTI spiked above $76 intraday Wednesday before finishing the week near $71 — up about 4% — as resumed supply outweighed the strikes.
- June existing-home sales fell 2.4% to a 4.09 million pace — still within this year’s 4.0–4.2 million range — with the median price at a record $440,600. The regional detail matched the split in the listings data: the Northeast was the only region where sales rose, with the fastest price growth; the South fell hardest, with price growth tied for slowest (NAR).
One market is half a percent from its record; another inside it has lost a fifth of its value in three weeks. Only one of them can be right about the AI trade, and the week ended without an answer. Tuesday’s CPI is the next test: the headline will be negative on June’s oil collapse — already partly reversed — so the core print is what moves September’s hike odds.
The chip selloff is deep at the median stock and invisible at the index
The median chip stock has lost a fifth of its value in three weeks; the index that contains it sits at a record. The AI-concentration story explaining this is by now consensus — roughly 41 AI names are ~45% of S&P capitalization (Jim Bianco’s count at Bianco Research), so money leaving them for the other 459 nets out flat. What the consensus frame misses is how much damage that netting hides. Samsung reported a record operating profit Tuesday and fell 7% because investors had priced in more; the SOXX chip ETF lost 6%; Friday, SK Hynix’s $26.5 billion Nasdaq debut popped 13% while the incumbent chip stocks didn’t rally (CNBC).
Bianco reads the rotation as broadening, not a top — “more upside to go.” Joseph Wang (Fed Guy) reads the dot-com template: leaders lag, money rotates, the broad index pushes to new highs — “and then something tumbles” — and this week matched the first half of that sequence almost to the letter. Lance Roberts (RIA Advisors), positioned for the benign version, named the kill switch on Thoughtful Money’s weekend recap: semiconductors are 18% of the index, and the SMH chart’s top pattern “hasn’t broken down yet… this is the one thing to watch.” His trigger lags the damage — the median chip stock is already in a bear market while his cap-weighted signal stays intact. Every indicator built on the index inherits that blindness; the destruction is real now, just below the weighting.
Investors priced the September hike; 30-year yields hit a 20-year high
In Wednesday’s minutes, the committee holds or eventually cuts if inflation pressures dissipate — and if inflation stays elevated on “strong AI-related demand, the conflict in the Middle East, or the effects of tariffs,” then “some policy firming would likely be warranted.” Investors took the second branch seriously — odds of a hike by September neared 70% — and Thursday’s 30-year auction stopped at 5.058%, the highest in about 20 years, with demand holding (Bloomberg). The 10-year ended the week near 4.56%.
The pricing hasn’t pulled individual forecasts with it: Bianco still leans hike on the real-rate math (core roughly equals the funds rate — a real rate of zero); Roberts still puts the odds of any move at “nothing,” with Warsh’s five data-review task forces giving him cover to sit until they report near year-end. The stronger hold case is Warsh’s own design — a chair who withheld his dot (presser transcript) and stripped the statement to “The Committee will deliver price stability” has left himself free to move either way.
Oil decides between them. Iran ended the ceasefire Tuesday; WTI spiked above $76 and faded to $71 as resumed supply outweighed the strikes. The fade is less reassuring than it looks: June’s spike-and-reversal was cushioned by inventory draws and China cutting imports, both now reversing — the next disruption meets thinner buffers. Roberts’s line for equities is $80–90 oil; even there he doubts the Fed acts, and puts the eventual move at a cut.
June home sales confirmed the North–South housing split
Existing-home sales fell 2.4% in June to a 4.09 million annual pace — inside the year’s 4.0–4.2 million range, still 2.8% above last June — while the median price set a record at $440,600 (NAR). The regional detail matches the inventory map: the Northeast, where listings are two-thirds gone, was the only region with rising sales (+2.1%) and the fastest price growth (+3.9%); the South, where unsold homes exceed pre-pandemic levels, fell hardest (−3.6%) with prices near flat. That mix is part of the record median — the shrinking market is increasingly priced by its most expensive, most starved region.
Tuesday’s CPI reflects June oil — which July already reversed
The June CPI, due Tuesday, is expected to print a negative headline month — consensus −0.1%, prediction markets leaning −0.2% (Kalshi) — on June’s oil collapse, with core at +0.3% and 2.9% on the year (Kiplinger). But that headline comes from oil prices that have already partly reversed, and core is the reason the real policy rate sits near zero. A soft core surprise is the one number this week that moves the September odds.
Snapshot
Watching
- CPI — Tuesday, Jul 14, 8:30 ET: consensus −0.1% headline / +0.3% core. The core number decides whether September’s 70% hike odds hold; the negative headline is June’s oil, already partly reversed.
- PPI — Wednesday, Jul 15: the pipeline check on the same question — June PPI should echo the energy drop; the ex-energy trend is what matters.
- Retail sales — Thursday, Jul 16 (cons. +0.3%): the consumer has carried the no-recession case all year.
- The strait and the Iranian-oil license wind-down (reported Jul 17): the next escalation meets thinner inventory buffers than June’s did.
- SMH / semiconductor breakdown: the named kill switch — a break of the chip index’s support with semis at 18% of the S&P is the one technical event that turns rotation into drawdown.
Sources
Data: FOMC minutes, June 16–17 (archived in the GeoMean data files); NAR June existing-home sales; DOL claims; semis drawdown (Yahoo Finance, Forbes/Intel); SK Hynix debut (CNBC); 30Y auction (Bloomberg); September hike odds (Forbes); CPI consensus (Kiplinger); oil path (WaPo, S&P Global). Voices: Jim Bianco (Bianco Research, Jul 3); Joseph Wang (Fed Guy Markets Weekly, Jul 4); Lance Roberts (Thoughtful Money weekly recap, Jul 10). Builds on the housing inventory divergence deep dive and the June ISM services note.