Summary of September New Residential Sales · October 27, 2026
- Census’s same-house price index averaged 0.2% above the prior four quarters, the weakest since 2012.
- The median fell 2.5% on the same basis; a cheaper mix of houses still explains the drop.
- September sales, 676,000, were statistically unchanged (Census/HUD CB26-174).
Same-house prices averaged 0.2 percent above the prior year, the least since 2012
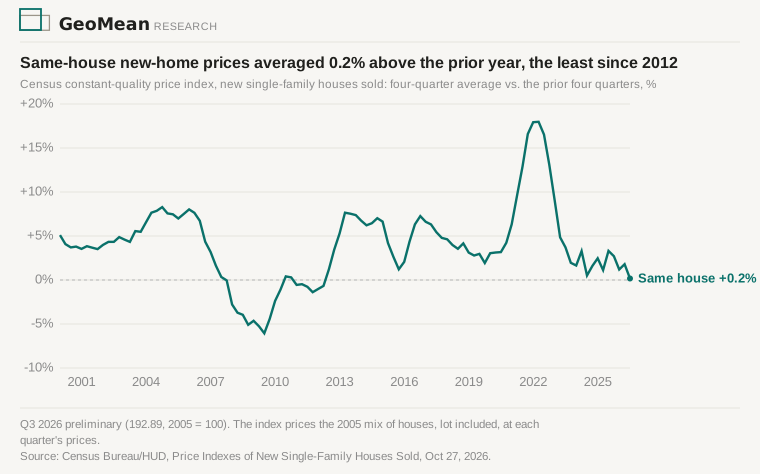
Census’s constant-quality index prices the same houses each quarter: the 2005 mix, lots included. Its four quarters to the third quarter of 2026 averaged 0.2% above the four before, the weakest since 2012, when the index was still falling. The preliminary third quarter fell 4.2% to 192.89, reversing a 4.1% second-quarter rise; only the fourth quarters of 2008 and 2023 fell more since 2000.
The third quarter’s 192.89 stayed above 192.4, the line the August new-home sales note set for a year-on-year fall. The second and third quarters together averaged 0.2% above the same quarters of 2025, so same-house prices are flat on the year.
A cheaper mix of houses still explains the median’s fall
Over the last four quarters the median new house sold for 2.5% less than in the four before, while the same-house index was 0.2% higher. The gap is the mix of houses sold, plus the difference between a median and a fixed-mix index.
In the third quarter alone, the index was 2.4% below a year earlier against a 4.1% drop in the median, which at $393,300 was the lowest since the second quarter of 2021. The index’s year-on-year change has swung from −1.5% to +2.8% to −2.4% in three quarters, so one quarter settles little.
Since 2021 the index has risen 14 to 16 percentage points more than the median, whether measured from the third quarter or from four-quarter averages.
New-home sales were 676,000, statistically unchanged
Sales were 0.6% (±13.8) below an August revised to 680,000 from 684,000, and 5.3% (±12.5) below a year earlier; neither change clears its margin of error.
Contract signings on existing homes fell 7.3% in September to a record low. Census also counts a new-home sale at contract, but its ±13.8% margin includes a fall that size, so the two cannot be told apart this month. Mortgage rates averaged 6.86% in September, against 6.35% a year earlier, and have run 7.28% to 7.40% in October. The release does not report builder incentives such as mortgage-rate buydowns.
Built homes for sale are the fewest since 2023
Built homes for sale, 361,000, are the fewest since December 2023, 6.4 months of sales at the current pace, about the same as a year earlier. Census’s 8.4 months also counts homes not yet started.
Homes not yet started reached a preliminary high of 115,000, within sampling error of August. Each of the last three highs was revised down: June’s 113,000 to 102,000, July’s 115,000 to 107,000, August’s 114,000 to 112,000.
Sources
Data: U.S. Census Bureau / HUD, Monthly New Residential Sales, September 2026 (Release CB26-174, census.gov), Tables 1a/1b (sales, inventory, price) and 3a/3b (stage of construction). August’s original 684,000 sales and 114,000 unstarted are CB26-155, September 24, 2026; July’s original 115,000 is CB26-128 and June’s 113,000 CB26-121. The 115,000 is the highest in the seasonally adjusted series (from 1999); unadjusted, 116,000 is the highest since 1973. The constant-quality index is Census’s Price Indexes of New Single-Family Houses Sold Including Lot Value (Laspeyres, 2005 = 100; third-quarter 2026 preliminary, second quarter revised from 201.07); the four-quarter figures compare the average of the fourth quarter of 2025 through the third of 2026 with the four quarters before, and the 192.4 line is the 2025 second- and third-quarter sum less the preliminary 2026 second quarter. Quarterly medians are Census’s Table Q6. The index and Table Q6 are rolling files; the October 27 copies are archived with this piece, with the historical files on stage of construction and houses sold from which every superlative is recomputed. Neither the index nor Table Q6 carries a published confidence interval, so the quarterly price comparisons are levels, not tested changes; all ± figures are the release’s 90% confidence intervals. The five-year comparison sets two nominal price measures against each other, so inflation affects both alike. Built-only supply divides under-construction plus completed inventory by one-twelfth of the annual sales rate. Mortgage rates: Freddie Mac Primary Mortgage Market Survey, weekly, as of October 22, 2026 (a rolling file; the archived copy is that vintage). Pending home sales: NAR, October 20, 2026. No agency publishes a consensus forecast for this release. Builds on the August new-home sales note and the September starts note. Next release: November 25, 2026.