Summary of September retail sales, October 15, 2026
- Sales rose 0.8 percent against a 0.4 forecast; August was revised up to 1.3 from 1.1.
- Gas stations accounted for $4.1 billion of the $5.7 billion increase.
- Outside gas stations, sales rose 0.2 percent and were unchanged after prices.
- After prices, core goods sales grew at a 3.4 percent annual rate last quarter, down from 6.5.
Sales outside gas stations were unchanged after prices
Excluding gas stations, sales rose 0.2 percent in September. Prices at those stores and restaurants rose about 0.25 percent, measured with each store type’s own consumer price index, so after prices their sales were unchanged; the 0.2 percent rise is itself within Census’s margin of error. In August they rose about 0.9 percent after prices.
Restaurants and bars, the report’s only services line, rose 1.1 percent against a 0.2 percent rise in menu prices, a gain inside the 1.6-point margin of error.
Gas stations’ sales rose about as much as gasoline prices usually bring
Gas stations’ sales rose 6.4 percent, and gasoline prices 9.1. Station sales usually rise less than fuel prices, because stations also sell food and other goods and because drivers can buy less fuel. Since 2023 they have risen about 0.6 percent for each 1 percent rise in gasoline prices, which predicted 5.8 percent for September; the pattern since 2017 predicted 6.9. September landed between the two, so the report shows no unusual cut in fuel buying.
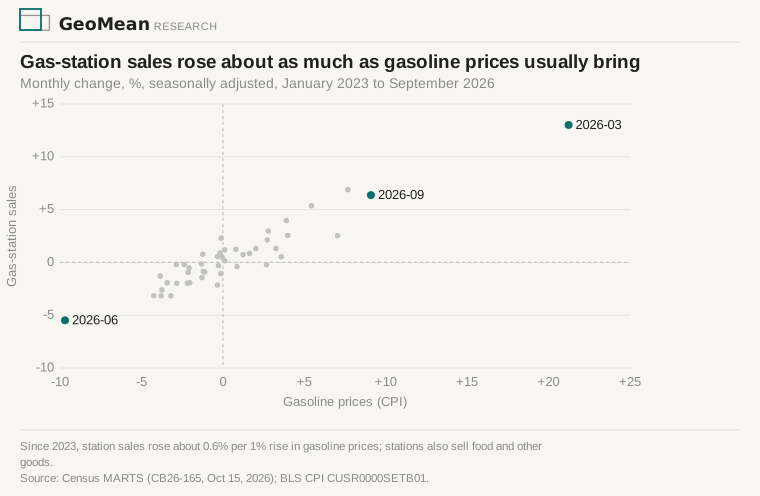
Gasoline prices are up 36 percent since February, lifting gas stations’ share of retail sales to 9.1 percent from 7.5. With that share, how total sales moved after prices depends on how much of a station’s sales is fuel, which the monthly report does not say. Across fuel shares of 60 to 100 percent, the change runs from a 0.2 percent fall to a 0.1 percent rise. Over 12 months, total sales are up 6.3 percent, and 3 to 4 percent after prices, depending on the fuel share.
Goods spending grew more slowly in the third quarter despite a strong August
Analysts use the “control group,” retail sales excluding car dealers, gas stations, building-materials stores and restaurants, to estimate much of the goods spending in GDP. It rose 0.1 percent in September after 1.2 in August, and was unchanged after prices. Census publishes no margin of error for it; its nearest published measure, sales excluding cars and gasoline, rose 0.2 percent, within its margin.
After prices, the group’s July-to-September average was 3.4 percent above the second quarter’s at an annual rate, after 6.5 percent growth in the second quarter. Most of that came from August: had August sales held at July’s level, the pace would have been about 0.4 percent. BEA’s first third-quarter GDP estimate comes out October 29.
Sources: Census Bureau, Advance Monthly Sales for Retail and Food Services, September 2026 (CB26-165, October 15, 2026), page 1 (changes, 90 percent margins, the August revision) and Tables 1–3 (sales by kind of business, standard errors); that URL serves the latest release, so the October 15 copy is archived with this piece; past releases are indexed at Census historical releases. Seasonally adjusted history by kind of business: Census files adv44X72, adv44000, adv44100, adv44400, adv44500, adv44700 and adv72200. Prices: BLS Consumer Price Index — September 2026 (USDL-26-1574) and seasonally adjusted series CUSR0000SACL1E, SAF11, SEFV, SETB01, SETA01 and SETA02 via api.bls.gov. Each store type is deflated by its closest price index (car dealers by new and used vehicles; food and beverage stores by food at home; restaurants by food away from home; building materials and the rest of the control group by goods less food and energy); totals are sums of the deflated parts. The gas-station relationship is a regression of monthly sales changes on gasoline-price changes, January 2023 to August 2026 (and, as a check, January 2017 to August 2026). The control group is computed from Census’s published categories. Forecast: economists’ consensus via CNBC, October 15. Restaurants’ margin is 1.753 times Census’s 0.9-point standard error. Companions: the GeoMean September CPI and PPI notes. Flat files, the puller and the chart spec are archived with this piece.