Summary of the Q2 2026 GDP third estimate, September 30, 2026
- Real GDP grew 2.2 percent in the second quarter, revised from 1.5, mostly on consumer spending, inventories and defense.
- BEA raised second-quarter gross domestic income by $507 billion; net interest rose $532 billion.
- Gross domestic income now exceeds GDP by $189 billion; before the update, GDP exceeded it by $241 billion.
- Domestic profits’ share of income, revised to 12.71 percent from 13.2, is still the highest on record.
- Real disposable income fell 0.2 percent in the quarter, not 1.5, and is up 1.0 percent over four quarters.
Business interest payments exceed the whole income revision
BEA’s annual update, released with the third estimate, raised second-quarter gross domestic income by $507 billion at an annual rate. Net interest (what businesses pay lenders, less what they receive, counted as the lenders’ income) rose $532 billion. Profits and proprietors’ income were revised down a combined $119 billion, less than a quarter of that, so the interest is mostly added income rather than relabeled profit. Compensation was revised up $126 billion.
Only the 2023 figure is a new count. BEA had estimated business net interest at $281 billion that year; 2023 tax returns put it at $562 billion, according to BEA’s annual-update article. With 2024 tax data unavailable, BEA extended that level with interest expense from company filings, and the revision grows to $471 billion in 2025. The 2026 quarters carry it forward.
Income-side GDP has exceeded spending-side GDP for three quarters
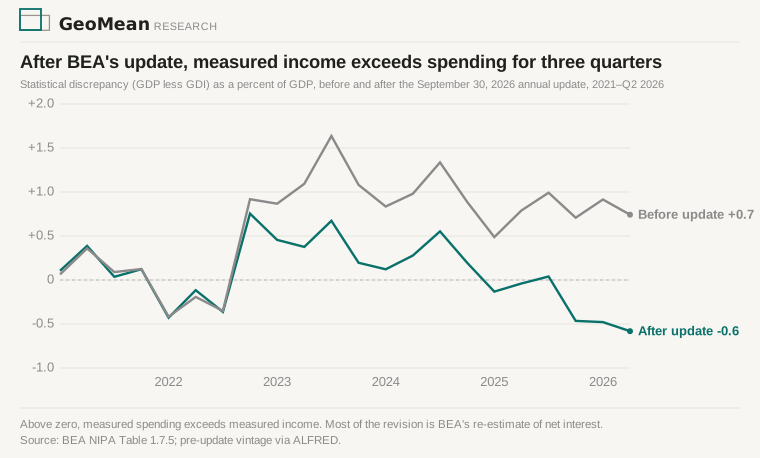
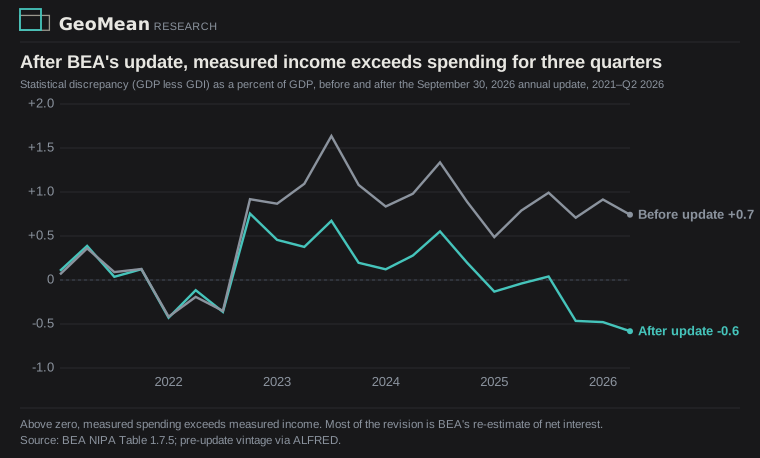
GDP measures output by what is spent on it, gross domestic income by the income it generates. The two should match; the statistical discrepancy, spending less income, is the gap BEA cannot reconcile. It was $241 billion in the second quarter before the update and is now −$189 billion, or −0.6 percent of GDP. The fourth and first quarters also changed sign.
The size is ordinary: 163 of 318 quarters since 1947 had a wider gap. The sign is what changed. Real GDP grew 2.2 percent and real GDI 2.6; the income figure rests on an extrapolation that 2024 tax returns, due in a future update, will test.
Profits kept a record share while households’ income loss nearly vanished
Profits from current production rose $384 billion, revised down $17 billion. Domestic profits’ share of income was revised to 12.71 percent from 13.2, still a record by 0.05 point over the fourth quarter of 1950. Compensation’s share was revised to 50.0 percent from 50.4, the lowest on record. Both records hold with net interest excluded.
Our August 26 note reported real disposable income down 1.5 percent in the quarter and down over four quarters. With the added interest income counted, the revised figures show −0.2 and +1.0, and the quarter’s saving rate rises to 4.4 percent from 2.8.
Sources: BEA, GDP (Third Estimate), Industries, Corporate Profits, State GDP, and State Personal Income, 2nd Quarter 2026 and Annual Update; State PCE, 2025 (BEA 26–42) and its release PDF, both archived, with the historical comparisons workbook. NIPA Tables 1.1.2, 1.7.5, 1.10, 1.12, 2.1 and 6.16D as published September 30. Pre-update figures: BEA’s second estimate (BEA 26–38) and its historical comparisons workbook, with the component levels as BEA published them through September 29, archived. Survey of Current Business, “The 2026 Annual Update of the National Economic Accounts”, Table 5 for the annual net-interest revisions. Revision attributions, income shares, share ranks with and without net interest, and the 1947–2026 discrepancy distribution were computed from those tables; the scripts and output are archived with this piece. Quarterly figures are seasonally adjusted annual rates.