Summary of August New Residential Sales · September 24, 2026
- The median new house sold for $393,700; with July’s revised $392,200, the two lowest months since July 2021 (Census/HUD CB26-155).
- Census’s constant-quality index is up 20% since the third quarter of 2021 and 8.3% since early 2023; the median is down 4.3% since early 2023.
- Sales were 684,000, up 6.4% from a July revised to 643,000; no national sales change clears its margin of error. A record 114,000 unsold homes are unstarted.
Median new-home prices sit at mid-2021 levels while the same house costs 20 percent more
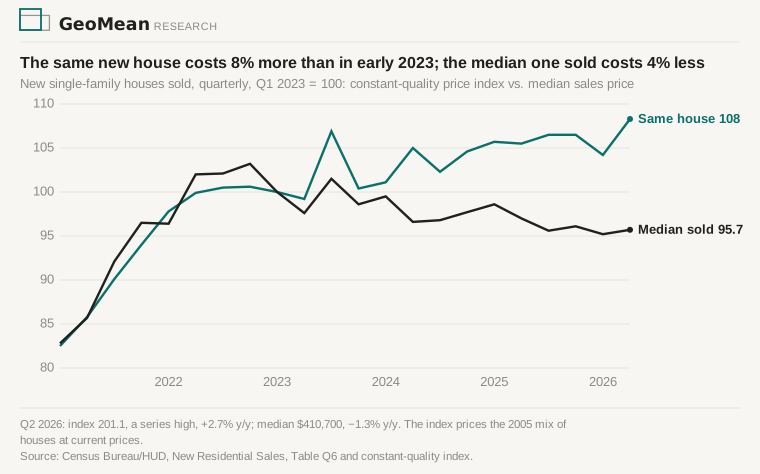
The median new house sold for $393,700 in August and a revised $392,200 in July, the two lowest months since July 2021; August is 5.8% (±8.2) below a year ago, inside its margin of error. The average, $478,700, fell 8.8% (±7.7), outside its margin.
Census’s constant-quality index prices the 2005 mix of houses at each quarter’s prices. The preliminary second quarter is 2.7% above a year earlier after a first quarter 1.5% below, so one quarter settles little. Since early 2023 the index is up 8.3% and the median down 4.3%; since the third quarter of 2021, up 20% against a median up 4%. A given house costs more than it did; the median fell because different houses are selling.
If the third-quarter index, due October 27, comes in below 192.4, same-house prices over the two quarters are down on the year.
Fewer sales above $1 million and in the West
Sales at $1 million and over were 4% of August’s total against 7% a year ago, a fall outside the table’s standard error; the rise under $300,000, from 18% to 22%, is inside it.
The West, where the median new house costs $546,700 against $410,700 nationally, sold 112,000 at an annual rate, 26.8% (±22.9) below last August, the only regional annual change outside its margin of error. Its 16.4% of national sales is the smallest share since July 2010; year to date it is 10.0% (±12.6) behind 2025, inside its margin. The release does not say why.
Unstarted homes are a record 114,000; built ones are the fewest since January 2024
Of 483,000 unsold new homes, a record 114,000 have not been started, the most since 1973 (preliminary; the last two records were revised down). The built ones, 369,000 against 397,000 a year ago, are the fewest since January 2024: 6.5 months of sales against 6.8 last August, while the headline 8.5 months counts the unstarted ones.
Completed unsold homes, 128,000 in January and the most since June 2009, have not risen since and stand at 113,000, while completed-home sales over twelve months, 386,000 unadjusted, ran close to the prior year’s 380,000. Fewer finished homes reached the market unsold, and single-family completions fell 7.6%.
Sales rose 6.4 percent from a July revised up 36,000; no national sales change clears its margin of error
Sales rose 6.4% (±19.5) on the month, fell 2.0% (±15.7) on the year, and are 2.9% (±5.1) below 2025 through August; July was revised from 607,000 to 643,000.
Midwest sales, 43,000 in July’s first estimate, were revised to 53,000 and came in at 98,000, inside the region’s prior-year range; July’s drop, which the July new-home sales note left open, was noise.
August’s buyers faced mortgage rates of 6.65% to 6.69%; the 6.95% of September 17 shows up in September’s sales, reported October 27.
Sources
Data: U.S. Census Bureau / HUD, Monthly New Residential Sales, August 2026 (Release CB26-155, census.gov), Tables 1a/1b (sales, inventory, region, price), 2a/2b (price brackets) and 3a (stage of construction). July’s original 607,000, 43,000 Midwest and 115,000 unstarted estimates are CB26-128, August 25, 2026; June’s original 113,000 unstarted is CB26-121, July 24, 2026. Superlatives are recomputed from Census’s historical files, archived with this piece: houses sold and for sale by stage (seasonally adjusted from January 1999, unadjusted from January 1973), houses sold by region (from 1973), sales price (from 1963), median and average price by region (Table Q6, quarterly) and sales by price bracket (quarterly). The constant-quality index is Census’s Price Indexes of New Single-Family Houses Sold (Laspeyres, 2005 = 100; second-quarter 2026 preliminary; the 192.4 test is twice the 2025 second- and third-quarter average less the 2026 second quarter), archived as pulled. All ± figures are the release’s 90% confidence intervals. Table 2b publishes standard errors on the bracket shares (3 points on the under-$300,000 share, 1 on the $1 million share); the stage-of-construction and quarterly regional-price tables carry no published intervals, and the West and national medians are second-quarter figures, so those are levels and shares, not tested changes. The 6.5-month built-only supply divides under-construction plus completed inventory by one-twelfth of the annual sales rate. Completions: Census/HUD CB26-147, Table 5a; single-family completions summed over the twelve months to August 2026 against the prior twelve. Finished homes reaching the market unsold is the twelve-month change in completed unsold stock plus completed-home sales over the same twelve months, unadjusted: about 376,000 against 398,000. Mortgage rates: Freddie Mac Primary Mortgage Market Survey, weekly history as of September 24, 2026 (a rolling file; the archived copy is that vintage). No agency publishes a consensus forecast for this release. Builds on the July new-home sales note, the August starts note and the August existing-home sales note. Next release: October 27, 2026.