Summary of August New Residential Construction · September 17, 2026
- Completions fell to a 1.128 million annual pace in August, the slowest since December 2018 (Census/HUD).
- Apartments were 112,000 of the 190,000 twelve-month decline in completions, tracking a fall in apartment starts 18 to 24 months earlier.
- Single-family starts rose in August, to a 918,000 annual rate, but trail 2025’s year-to-date pace by 4.7%.
- Year to date, only the Northeast’s single-family starts fell by more than the margin; the South’s did not.
Fewer apartments were finished because fewer were started in 2024
Over the past twelve months builders completed homes at an average 1.365 million annual rate, 12.2% below the year before. August’s 11.9% (±9.7) monthly drop was significant, but its preliminary 1.128 million sits 17% below that average; Census needs six months of completions to call a trend.
Apartments (buildings with five or more units) account for 112,000 of the 190,000 decline, although apartment starts rose 46,000 over the same twelve months. Census’s Survey of Construction put a building of 20 or more units at 19.1 months from start to finish in 2025, and apartment starts 18 to 24 months earlier had fallen 99,000 to 154,000 from a year before. Single-family completions fell 76,000, close to the 71,000 fall in single-family starts over the same months; single-family starts have run lower for about two years, so no particular lag stands out.
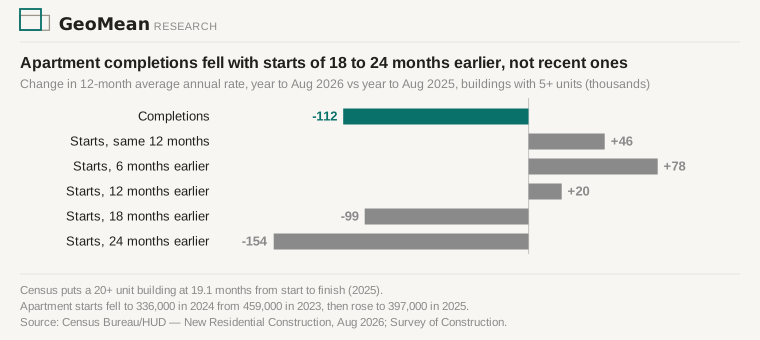
Apartment starts rose 18% in 2025, to 397,000. If build times hold, apartment completions from September through February will average more than the past six months’ 411,000 annual rate; the February report, due in March, settles it.
Single-family starts rose in August but trail 2025’s pace
Census revised July’s single-family starts to an 853,000 annual rate from 808,000, above September 2025’s 837,000, so July is no longer the lowest month since 2022. Total July starts were revised up 5.6%; Census says preliminary estimates are revised 3.8% or less on average.
August single-family starts rose 7.6% (±14.0) to 918,000, and total starts fell 2.6% (±12.0) to 1.275 million because apartment starts fell 22.5% (±24.9); none clears the margin. Single-family starts are 4.7% (±3.2) behind 2025’s year-to-date pace and 1.8% below a year earlier on a six-month average. Permits fell 2.7% to 1.394 million, and homes authorized but not yet started rose to 280,000, 12.9% (±7.1) above a year ago; units in apartment buildings rose 15.3% (±13.3), while the single-family rise is within the margin.
Only the Northeast’s single-family starts fell significantly this year
July’s southern decline did not repeat in August, when southern single-family starts rose 7.5% (±14.3) on the year. Year to date the South, which starts 59% of the country’s single-family homes, is 2.2% (±4.0) behind 2025, within the margin. The Northeast, with 6% of starts, is the only region whose decline clears it, at 15.9% (±5.7); the release does not say why.
Sources
Data: U.S. Census Bureau / HUD, Monthly New Residential Construction, August 2026 (Release CB26-147, census.gov) — Tables 1a (permits), 2a (authorized but not started), 3a/3b (starts), 5a (completions). July first estimates: CB26-127. Monthly figures are seasonally adjusted annual rates; year-to-date and 2023–2025 annual figures are unadjusted. All ± figures are the release’s 90% confidence intervals; a range containing zero means the change is not statistically significant. Twelve-month and six-month averages, the lagged-starts comparisons and the “since December 2018” and September 2025 comparisons are computed from Census’s seasonally adjusted history (starts, completions; these files update monthly, and the September 17, 2026 versions are archived with the script that produced the figures). Build times: Census/HUD Survey of Construction, average length of time from start to completion, 2025. No consensus forecast for August starts could be traced to a citable source, so no beat/miss framing appears here. Follows the July starts read and the July new-home sales read.