Summary of August Existing-Home Sales · September 10, 2026
- Sales ran at a 3.98 million annual pace, down 2.0% from July and 1.2% on the year (NAR) — about 30,000 a year below the band that held every month of 2026.
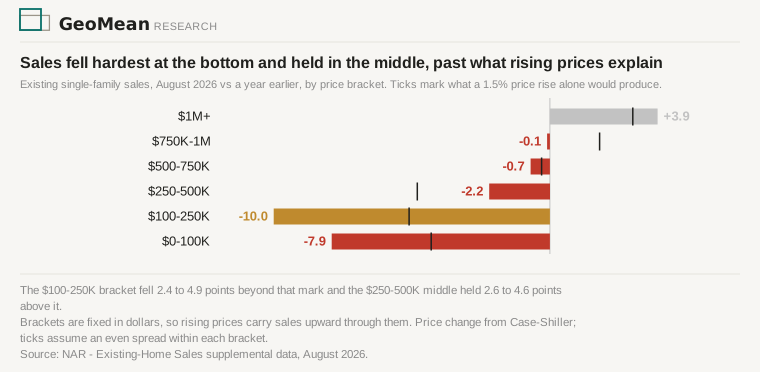
- Sales between $100,000 and $250,000 fell 10.0% where rising prices alone carry out 5.1%, while the $250,000-to-$500,000 middle fell 2.2% against 4.8%.
- Inventory reached 1.62 million homes, 5.9% above a year ago; Realtor.com counted 66,000 more listings over twelve months, and sales rose.
- The rate behind August’s closings was 6.54%, five basis points above the rate behind July’s; the release’s 6.67% reaches closings in the fall.
The bottom fell hardest and the middle held
NAR’s supplemental table counts single-family sales by price bracket, unadjusted. Those brackets are fixed dollar amounts, so rising prices move houses between them: a $248,000 house last August is a $252,000 house this August, counted one bracket higher. Part of any decline at the bottom is arithmetic, not demand.
On the 1.5% Case-Shiller measured, that arithmetic takes 5.1% of sales out of the $100,000-to-$250,000 bracket. It fell 10.0%. The $250,000-to-$500,000 middle should have fallen 4.8% and fell 2.2%. Both gaps survive any reasonable guess about how homes sit inside a bracket, though their size runs anywhere from about 2.5 points to nearly 5.
Investors and second-home buyers took 15% of August’s sales against 21% a year ago; the release does not break those shares out by price.
Appreciation, not a shift in buyers, lifted the median
Recomputing the median from the bracket shares returns 1.5% to 2.1%, around the 1.6% reported — and the same arithmetic reproduces the whole of it. Six fixed dollar brackets cannot separate which homes sold from what homes are worth.
Case-Shiller, which prices repeat sales of the same houses, had them up 1.5% in June — close to the median’s own move, so the increase is appreciation. Its August reading publishes in late October.
Listings built the inventory, and sales rose
Over the twelve months to August, owners listed 4.73 million homes against 4.66 million the year before (Realtor.com) — 66,000 more. Sales did not fall over that stretch; NAR counts them up 1.6% through August. Listings built the stock and selling drained it. The flows do not close the 90,000-home gap, and the two counts of the stock disagree — Realtor.com’s is up 3.6% against NAR’s 5.9%. Distressed sales held at 2%, unchanged on the month and the year.
July’s contracts fell as rates climbed inside the month
Within July the mortgage rate climbed from 6.43% to 6.66%, and July’s contracts fell with it: pending home sales, which count signings rather than closings, fell 2.3% — published August 18, three weeks before this report.
Lawrence Yun (NAR chief economist) blamed high mortgage rates, and that climb supports him; the 6.67% the release quotes does not. August’s closings were signed in July at 6.54%, five basis points above the 6.49% behind July’s. NAR reports August’s contracts on September 17.
Sources
Data: National Association of REALTORS®, Existing-Home Sales, August 2026 (released Sept 10, 2026) and its supplemental data tables; Pending Home Sales, July 2026 (released Aug 18, 2026). Listing counts: Realtor.com Economic Research, monthly national inventory through August. Mortgage rates: Freddie Mac Primary Mortgage Market Survey, weekly. Repeat-sales prices: S&P Cotality Case-Shiller US National Home Price Index, June 2026. The bracket decomposition, the price-change null and the mortgage-rate windows are archived in the GeoMean data files with the scripts that produced them. Follows July’s existing-home sales note and the housing inventory divergence deep dive.
Correction
September 16, 2026 — NAR has revised July’s inventory up to 1.57 million homes from the 1.54 million first reported. Our July note said supply “fell in July”; on the revised series it held flat at 1.57 million through May, June and July, and rose in August. That note’s year-ago inventory comparison was computed on the 1.54 million first print.