Summary of the August 2026 Employment Situation, September 4, 2026
- Nonfarm payrolls rose 162,000 against a 53,000 consensus, and June and July were revised up a combined 55,000 (BLS, archived; consensus per CNBC).
- Restaurants and bars (+59,000) and local government education (+42,000) supplied 101,000 of the gain, both rebounding from earlier declines.
- The labor force grew 683,000 after shrinking 984,000 over June and July; unemployment held at 4.1 percent and participation rose to 61.6 percent.
- Average hourly earnings rose 3.1 percent from a year ago, the slowest since May 2021, against 3.4 percent consumer inflation in July.
August reversed both surveys’ summer pattern in one month, and the detail is two rebounding sectors and a household swing the survey produces routinely. What the report did not contain is wage pressure: earnings growth fell to 3.1 percent, again below inflation.
Restaurants and local school districts supplied 101,000 of the 162,000, and both follow declines
Food services and drinking places added 59,000 jobs against a prior-12-month average of 12,000; local government education added 42,000 after July’s seasonally adjusted drop of 50,000, and BLS notes the sector “has shown little net change since January 2025” (BLS, archived). Both are rebounds from drops in the June and July reports (local education −58,000 in July, revised from −50,000; leisure and hospitality −75,000 over the two months), so the fairer pace is the two-month average, 92,000, or 71,000 over three. ADP’s leisure-and-hospitality count was 16,000, a quarter of BLS’s 62,000 (ADP): a seasonal rebound, not a hiring turn. Outside those two lines: private +127,000 and government +35,000; health care +13,000 against a 32,000 average; information −23,000; manufacturing +16,000. 12 of 14 supersectors grew, the widest breadth since December 2023 (our archived CES series).
Revisions were positive for the first time since the May report: June from +20,000 to +31,000, July from −23,000 to +21,000. The 2026 private pace is 84,000 a month against 25,000 for all of 2025 (our archived series).
A 683,000 labor-force swing is routine for the household survey
For the first time since May, the unemployment rate was not held down by people leaving. The labor force grew 683,000 after shrinking 720,000 in June and 264,000 in July; household employment rose 569,000, the unemployed count rose 115,000, and the rate held at 4.1 percent. Participation rose to 61.6 percent, still 0.5 points below January, and full-time employment rose 735,000 (Table A-9). The release gives no reason for the rebound; the survey does not ask.
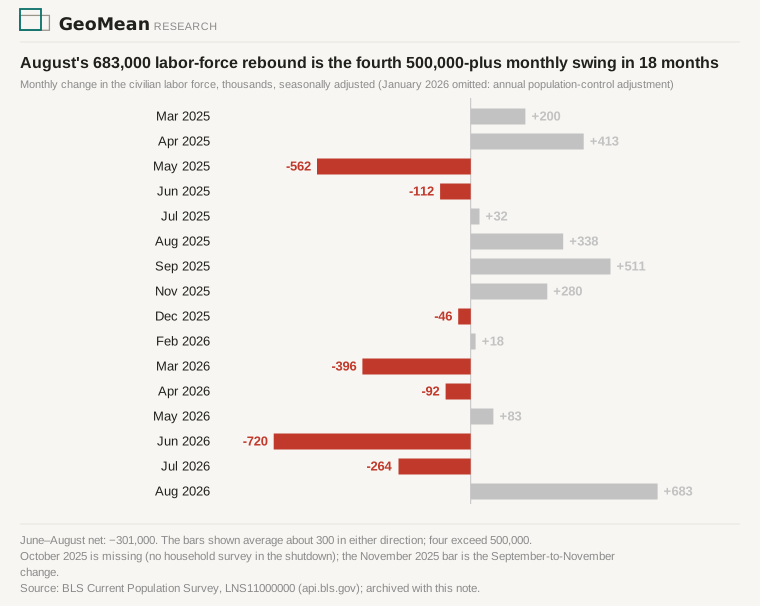
The swing is inside the survey’s range: four of the past 18 monthly labor-force changes have exceeded 500,000 in either direction (a fifth, January’s, is the annual population adjustment), and the June-to-August net is −301,000. June’s 720,000 exit was one month too; the read rests on the year. Over 12 months the labor force is 973,000 smaller, unemployment is lower on every measure but the long-term one (U-3 4.3 to 4.1 percent, U-6 8.1 to 7.7; U-1 1.7 to 1.8), and native-born employment is down 587,000 with foreign-born flat (Tables A-7, A-15). A second month of 500,000-plus entry, or participation back above 62 percent, would reverse that read; one of its markers already moved, the full-time employment gap from a year ago shrinking from 1.29 million in July to 180,000 (Table A-9).
ADP counted 38,000 private jobs against BLS’s 127,000, and has factories shrinking
On hiring the trackers agree with BLS on the level, slow, but not on August’s direction: ADP’s 38,000 was its smallest gain since January, BLS’s 127,000 private the largest since April. ADP has manufacturing −17,000 where BLS has +16,000; ISM’s August factory employment index, 51.2 and above 50 a second month, sides with BLS (ISM). Bank of America’s deposit data show lower-income after-tax pay growing faster than higher-income, 4.7 against 3.5 percent — partly, by BofA’s own caveat, on lower withholding under the new tax law (BofA Institute).
Wages grew 3.1 percent, the slowest since May 2021 and 0.3 points below inflation
Average hourly earnings rose 10 cents to $37.75, up 3.1 percent from a year ago against a 3.0 percent consensus. Against July’s 3.4 percent consumer inflation, real hourly pay is down about 0.3 percent on the year (Table B-3; July CPI note). The nominal wage bill is up 4.3 percent on more hours and more people (Table B-4): real aggregate pay is growing about 0.9 percent while real pay per hour falls.
Investors raised September hike odds to about 60 percent on the payroll beat, not on wages
Fed Governor Christopher Waller said the day before that the labor market was “not a large factor” in his vote and that he expected “more of the same” (Fed, archived). Futures pricing for a September hike rose anyway, from about 50 percent to 58–60 percent by the close (CNBC). The case for a hike is the payroll beat and the upward revision; the case against is 3.1 percent wages and a labor force growing again. Waller’s stated reason for waiting was the inflation trend, not jobs; The August inflation data he named arrive with CPI on September 11.
Sources
BLS Employment Situation, August 2026 (archived) — Tables A-1, A-7, A-8, A-15, B-1, B-3, B-4 and CES/CPS series via api.bls.gov, archived with this note · consensus: CNBC · Fed pricing: CNBC · Waller, September 3 · Builds on the July jobs note, the benchmark note and themes/labor-market.