Summary of July JOLTS, September 1, 2026
- Openings were little changed at 7.27 million; June was revised down 177,000, cutting June’s openings-per-unemployed ratio from 1.04 to 1.01.
- July’s ratio, 1.05, is the highest since January 2025 — two-thirds of the rise from 178,000 fewer unemployed as the labor force shrank 264,000.
- The labor force grew 683,000 in August; the June–August net is still −301,000.
- Quits 1.9% (a 13th month at or below 2.0%), hires 3.2%, layoffs 1.0%: no labor case for a move on September 15–16.
The larger move in July’s JOLTS was the revision (BLS JOLTS): June’s openings were cut 177,000 to 7.18 million, so the ratio the June JOLTS note reported as a 17-month high of 1.04 now stands at 1.01. July reset the high at 1.05 — 7.27 million openings against 6.92 million unemployed — and again on the denominator.
Fewer unemployed, not more openings, pushed the ratio to 1.05
Openings rose 89,000 from the revised June level; the unemployed count fell 178,000, to 6.92 million (BLS Employment Situation, Summary table A). Held at June’s unemployed count, July’s ratio would be 1.02; held at June’s openings, 1.04. And the unemployed did not leave the count by finding jobs: household employment fell 87,000 in July and the labor force shrank by 264,000, the second straight month of exit after June’s 720,000.
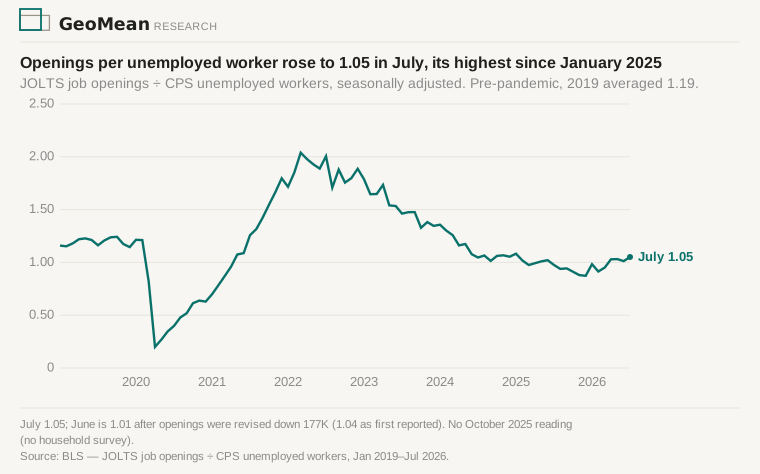
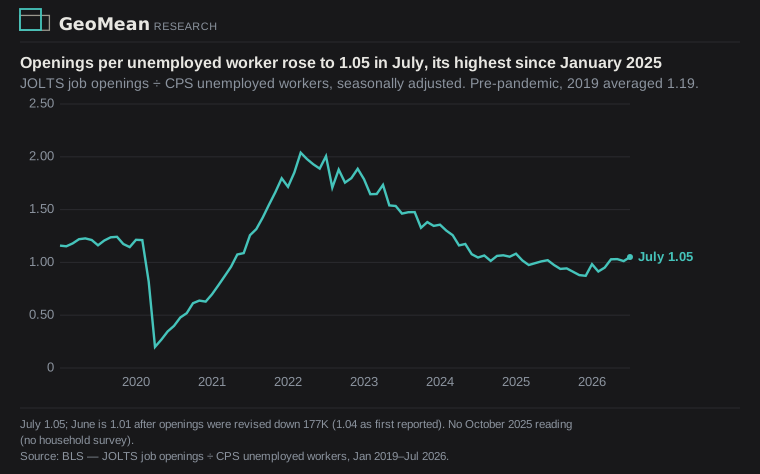
The labor force grew 683,000 in August, leaving the June–August net at −301,000
The labor force grew by 683,000 in August, household employment by 569,000, and the unemployed count by 115,000; participation rose to 61.6% with unemployment unchanged at 4.1% (BLS, table A). July had gone the other way (participation 61.4%). July’s openings against August’s unemployed count give a ratio of 1.03.
Swings this size are common in the household survey — four of the past 18 monthly labor-force changes exceeded 500,000 in either direction, June’s −720,000 among them, and a fifth, January’s, was the annual population adjustment — so neither month settles it (BLS CPS series LNS11000000, archived with the August jobs note). The June–August net is −301,000, participation is 0.5 points below January, and the labor force is 973,000 smaller than a year ago. Whether the exit resumed or ended, the September report on October 2 will show.
Quits fell to 1.9%, a 13th month at or below 2.0%
Workers still aren’t quitting and employers still aren’t firing. Quits fell to 1.9% against a 2.3% average in 2019; hires ran 3.2% (2019: 3.9%), layoffs 1.0% (2019: 1.2%) (BLS JOLTS; 2019 averages from the archived series). Hires minus separations came to −18,000, in line with July’s payroll change of +21,000 after revision: employers are neither adding nor shedding.
Layoffs at 1.0% make no case for a cut; Waller called the labor market “stable”
Governor Christopher Waller (Fed) said on September 3 that “the labor market is stable, with employment near its maximum sustainable level,” and that it is “not a large factor” in his September vote (Fed). This release fits that reading. Layoffs at 1.0% make no case for a cut; openings flat in their band, hires at 3.2%, and quits at 1.9% make no case for a hike — that case runs through core PCE at 3.3% (July PCE note), not through labor. One caveat on “stable”: the ratio rose in June and July because people left the labor force, not because employers posted more jobs, so 4.1% unemployment says less about demand than it did when the ratio was 1.19 and hires ran 3.9% in 2019. The next JOLTS lands September 29, two weeks after the meeting.
Sources: BLS Job Openings and Labor Turnover Survey, July 2026 (USDL-26-1432) — openings, hires, quits, layoffs, and separations, levels and rates, the June revisions, and Table A industry detail; the series are archived with this piece alongside the puller script. BLS Employment Situation, August 2026 (USDL-26-1435), Summary tables A and B, for the household side (labor force, employment, unemployed, participation) and the July payroll revision. Christopher Waller, “The Economic Outlook and Some Comments on My Policy Communication”, September 3, 2026. The ratio divides JOLTS openings by CPS unemployed (LNS13000000); the October 2025 observation is missing (no household survey that month), and the January 2025 comparison stands either side of the gap. The 2019 averages and the quits streak are counted from the archived series. Builds on the June JOLTS note and the July PCE note.