Summary of July PCE, August 26, 2026
- Core PCE rose 0.246 percent; the 12-month rate held at 3.3 where 3.2 was expected.
- Investment-management fees rose 5.6 percent — 46 percent of the month’s core increase, and 42 percent of July 2025’s.
- Without that line core rose 0.14 percent and runs 3.0 percent over 12 months.
- Core PCE is 0.87 points above core CPI, the widest gap since at least 2017.
| July 2026, PCE | m/m (SA) | y/y |
|---|---|---|
| PCE price index | +0.2% | +3.7% |
| Core PCE (ex food & energy) | +0.246% | +3.3% |
| Core PCE excluding portfolio management | +0.14% | +3.0% |
| Core PCE, 3-mo / 6-mo annualized | 3.0% / 3.5% | — |
| Portfolio management & investment advice | +5.6% | +20.8% |
| Core CPI (same month, for comparison) | +0.2% | +2.5% |
| Real disposable income | +0.4% | — |
| Real PCE (spending) | +0.0% | — |
| Personal saving rate | 3.0% (June: 2.6) | — |
Investment fees were half of July’s core, as in July 2025
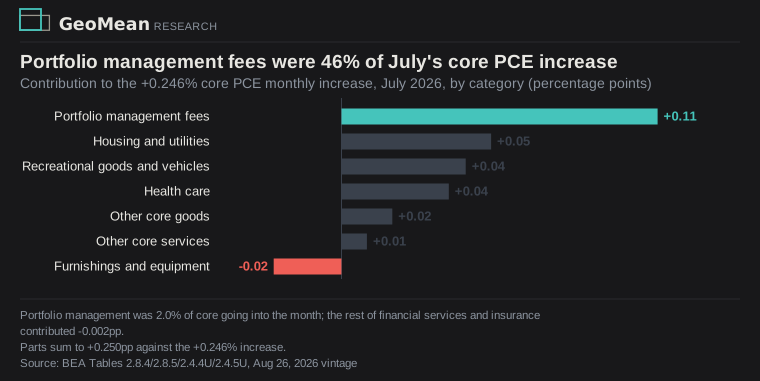
Portfolio management and investment advice, 2.0 percent of core PCE going into the month, rose 5.6 percent and contributed 0.112 of the month’s 0.246 percentage points — 46 percent of it.
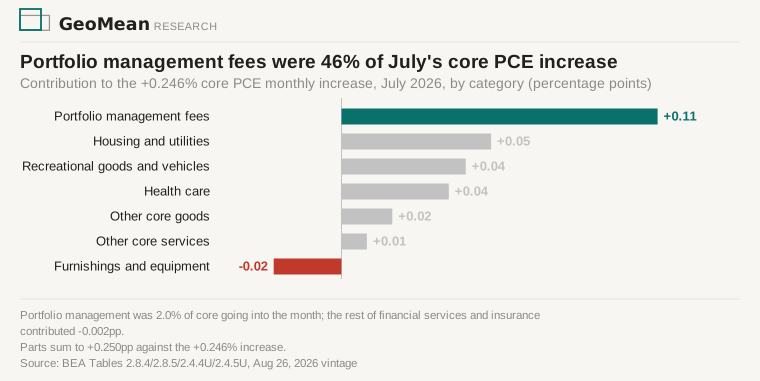
Managers bill the fee as a percentage of the assets they hold, and BEA deflates the line with a BLS producer price index that tracks the prior quarter’s S&P 500. That index rose 6.5 percent in July, published August 13.
The same line rose 5.7 percent in July 2025 and carried 42 percent of that month’s core increase; in April 2025 it fell 6.2 percent and subtracted more than half of that month’s. It has done this in five of the 25 months on file since mid-2024, four times up and once down.
BEA replaces the method on September 30, deriving the quantity of these services from industry employment instead — part of the annual update it previewed in June, which restates 2021 through the first quarter of 2026. Thomas Wash (Confluence Investment Management) put the effect at “an additional 0.2 percentage points” off measured inflation.
Without investment fees core is 3.0 percent, not 3.3
Excluding portfolio management, core PCE rose 0.14 percent in July and runs 3.0 percent over 12 months; BEA’s own market-based core, which strips imputed services, agrees at 3.0. That line does not explain why core runs more than a point above the Fed’s 2 percent objective.
The three run rates disagree — 3.0 percent over three months, 3.5 over six, 3.3 over twelve — and core has been above 3 on all three since March. Last August through December averaged 0.23 percent a month, so repeating July’s pace leaves core at 3.4 percent in December. The FOMC meets September 15–16 with August CPI and PPI in hand; August PCE arrives September 30, after it decides.
Core PCE has run above core CPI since November
Core PCE has run above core CPI in every month since November 2025 (October 2025 CPI was never collected), and at 0.87 points the gap is now the widest in the 114 months since January 2017 — across which core PCE averaged 0.40 points below. Strip financial services and insurance from core PCE and its annual rate falls to 2.9, closing about half the gap; health care, weighted more than twice as heavily in PCE, is most of the rest. CPI has no portfolio-management item at all — it excludes investment costs by design.
Income outran spending and the saving rate rose
Real disposable income rose 0.4 percent while real spending was flat. Goods spending fell 0.6 percent after June’s 0.6 percent gain, over half of it recreational goods and vehicles. The saving rate rose to 3.0 percent from a revised 2.6, its first increase since January.
Sources: BEA, Personal Income and Outlays, July 2026 (PDF) — income, spending, saving, and headline price figures. Run rates, category weights, and the contribution decomposition computed from BEA Tables 2.6, 2.8.1, 2.8.4, 2.8.5 and underlying-detail Tables 2.4.4U and 2.4.5U (August 26, 2026 vintage). Methodology change: BEA, Preview of the 2026 Annual Update of the National Economic Accounts, June 2026 and BEA, “Annual Update of GDP, Industry, and State Stats Publicly Available Starting Sept. 30,” August 17, 2026. The 0.2-point estimate: Thomas Wash, Confluence Investment Management, “The PCE Makeover,” August 3, 2026. Consensus figures are FactSet’s, via Morningstar, August 25, 2026. The producer index’s fit against the prior quarter’s S&P 500 (r² 0.83 across 31 quarters since Q4 2018) is computed in our July PPI analysis. CPI’s exclusion of investment costs: BLS, CPI Frequently Asked Questions. Producer-index figures and the S&P relationship via our July PPI analysis and the BLS release. Core CPI via our July CPI deep dive and the BLS release; CPI weights from its Tables 2 and 7; the core PCE–core CPI wedge series is archived with this piece. FOMC dates per the Federal Reserve calendar; August CPI and PPI dates per the BLS release schedule. Monthly figures are seasonally adjusted at a monthly rate; BEA revised April through June with this release.