Summary of July New Residential Sales · August 25, 2026
- Unsold new homes rose 1.9% (±1.2) to 488,000 — all 9,000 units of it unstarted (Census/HUD CB26-128).
- Months’ supply is 9.6 counting every stage; counting only built houses, 7.4 — the same as last July.
- Sales ran at 607,000, against a June revised 628,000 → 678,000.
Supply is 9.6 months, or 7.4 in built houses
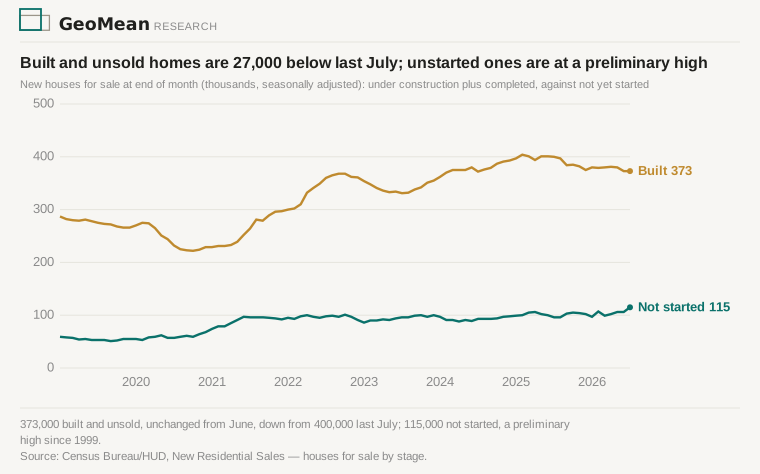
Unsold homes reached 488,000, up 1.9% (±1.2) — the only national figure in this release that clears its margin of error. Every unit of the increase is a house not yet started, 106,000 to 115,000; under construction fell 3,000 and completed rose 3,000. Of the 488,000, 373,000 are built — unchanged from June, 27,000 below last July.
Census counts all three stages in months’ supply, so July’s 9.6 months includes 115,000 houses that do not physically exist. Counting only the built ones, supply is 7.4 months against 7.4 last July. The total is no larger than last July’s 496,000; only the mix moved.
The 115,000 is preliminary. June’s unstarted count first printed at 113,000 and now reads 106,000. Single-family starts are down 15.7% on the year and single-family homes authorized but not yet started are up 9.6%. Builders are breaking ground on less, and the release does not say why.
Midwest sales halved while its builders held steady
Midwest sales ran at 43,000, down 42.7% (±13.4) on the month and 50.6% (±10.6) on the year — the only regional figures here whose intervals exclude zero, and the weakest Midwest month since September 2012. That 44,000-unit annual decline exceeds the 41,000 the whole country lost, itself a change inside its margin (−6.3%, ±19.6).
Midwest single-family starts printed 113,000 against 118,000 a year earlier — a change the survey cannot separate from zero (±24.7), whose range nowhere reaches the 50.6% fall in sales. Unsold homes in the region rose to 59,000 from 50,000.
If September 24 puts Midwest sales back in their 66,000–106,000 range of the past year, July was noise; if they hold near 43,000 while regional inventory rises, the Midwest’s problem is buyers, not a shortage of homes — the opposite of its existing-home market, where listings are scarce and contracts are up.
June’s upward revision made July’s drop look three times bigger
June was published a month ago at 628,000 and is now 678,000 — an 8.0% revision against Census’s stated ~5% average. Against June’s own first estimate, July’s first estimate is 3.3% lower, not 10.5%. The published monthly change carries a ±14.0 interval, which neither version clears.
The median new house sold for $393,800, the lowest monthly median since July 2021 and about 16% below it in real terms — also not a significant change (−0.9%, ±6.9).
New-home sales catch a rate move before resales do
Census counts a new-home sale at contract signing, not closing, so July’s number already carries July’s rates — 6.43% to 6.66% on Freddie Mac’s weekly survey, against June’s 6.47% to 6.52%. Resales are counted at closing; September’s existing-home report is the first to reflect them. Neither sales change here clears its margin, so July neither shows the rate biting nor rules it out.
Sources
Data: U.S. Census Bureau / HUD, Monthly New Residential Sales, July 2026 (Release CB26-128, census.gov) — Tables 1a/1b (sales, inventory, region, price) and 3a (stage of construction). June’s original 628,000 and 113,000 estimates are CB26-121, July 24, 2026. Superlatives were recomputed from Census’s own historical files — houses sold and for sale by stage of construction (seasonally adjusted from January 1999), houses sold by region (from 1973) and sales price of new houses sold (from 1963) — all archived with this piece, as is the 7.4-month calculation (under construction plus completed, divided by one-twelfth of the annual sales rate). All ± figures are the release’s 90% confidence intervals; the stage-of-construction tables carry no published intervals, and Census publishes no seasonally adjusted regional inventory, so those figures are levels rather than tested changes. Starts and authorizations: Census/HUD CB26-127, Tables 2a/3a. Mortgage rates: Freddie Mac Primary Mortgage Market Survey, weekly history as of August 25, 2026 (a rolling file; the archived copy is that vintage). The real price comparison deflates by CPI-U, not seasonally adjusted (BLS series CUUR0000SA0: 273.003 in July 2021, 333.918 in July 2026), archived with this piece. No agency publishes a consensus forecast for this release. Builds on the July starts note, the July existing-home sales note, and the June new-home sales note. Next release: September 24, 2026.