Summary of July New Residential Construction · August 18, 2026
- Housing starts fell 12.4% in July to a 1.239 million annual pace, a statistically significant drop; June’s apartment-driven jump was revised down to 1.415 million (Census/HUD).
- Single-family starts fell to 808,000 — the lowest since November 2022, and down a significant 15.7% from a year ago.
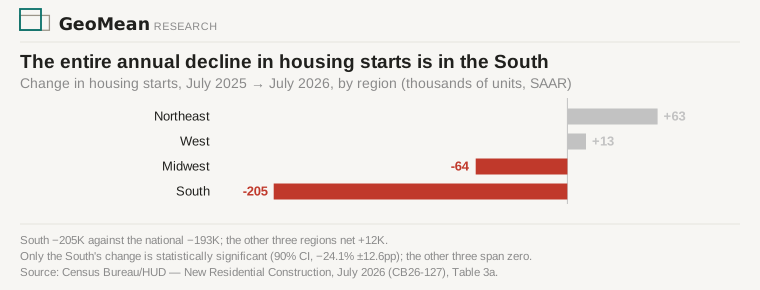
- The South accounts for more than the entire annual decline in total starts, and about two-thirds of the single-family decline.
- Permits rose 5.0% to 1.443 million, homes authorized but not yet started rose a significant 10.3% on the year, and completions are the lowest since May 2020.
June’s apartment jump reversed, and single-family fell with it
Total starts dropped 12.4% (±9.5%) to 1.239 million. June’s 19% jump was all apartments, and the bounce reversed in July: apartment starts (buildings with five or more units) fell from 499,000 to 421,000. Single-family starts fell too, to 808,000. The monthly interval (−9.9% ±10.4%) spans zero, but the level is the lowest since November 2022, the decline from a year ago (−15.7% ±8.6%) is significant, and 2026’s year-to-date single-family starts run 6.9% (±3.2%) behind 2025 (Census/HUD Tables 3a, 3b). Level, annual change, and year-to-date pace all point one way: builders are starting fewer houses.
Every unit of the annual starts decline sits in the South
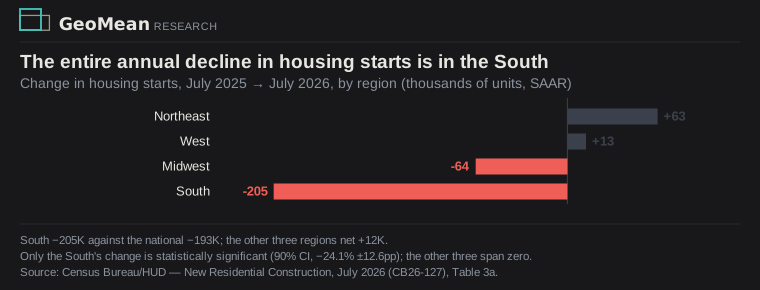
Southern starts fell to 645,000 from 850,000 a year ago — down 24.1% (±12.6%), the only regional total that clears the confidence interval. That is a 205,000-unit decline against 193,000 nationally; the other three regions net slightly positive, each within its margin. Southern single-family starts fell a significant 16.2% (±12.4%) — about two-thirds of the national single-family decline (97,000 of 151,000). The pullback sits in the oversupplied half of the country, where resale inventory is back above pre-pandemic levels and June’s new-home report showed the builder discount doubling while unsold new supply sat at 9.3 months. The region already holding the unsold homes is where ground-breaking is falling.
Permits rose, but more authorized homes sit unstarted
Permits climbed 5.0% to 1.443 million, recovering June’s dip; single-family authorizations, at 894,000, are 1.1% above a year ago — flat. (The release publishes no confidence intervals on permits.) The gap between authorizing and starting is widening: homes authorized but not yet started rose to 279,000, up 4.1% (±2.5%) for the month and 10.3% (±7.3%) on the year. The release doesn’t say why builders hold authorizations without breaking ground. Further down the line, homes under construction are down 6.0% (±2.6%) from a year ago, about a quarter below their October 2022 peak, and completions, at 1.212 million, are the lowest since May 2020 — fewer homes finishing means less new supply arriving into that overhang.
In June, single-family building was flat and concentrated in the wrong half of the country to thaw the resale freeze. In July it fell. A mortgage rate well below 6.5% is still what it would take to restart building, and rates went the other way: the 30-year averaged 6.67% last week (Freddie Mac). The August report lands September 17.
Sources
Data: U.S. Census Bureau / HUD, Monthly New Residential Construction, July 2026 (Release CB26-127, census.gov) — Tables 1a (permits), 2a (authorized but not started), 3a/3b (starts), 4a (under construction), 5a (completions). Figures are seasonally adjusted annual rates, except Tables 2a/4a (seasonally adjusted end-of-period stocks) and year-to-date figures (unadjusted, Table 3b); permits (Table 1) are a non-probability sample not subject to sampling error, so no confidence intervals are published for them. All ± figures are the release’s 90% confidence intervals; a range containing zero means the change is not statistically significant. “Lowest since November 2022” (single-family starts) and “lowest since May 2020” (completions) verified against the Census series history, archived back to 2015 with this piece. Mortgage rate: Freddie Mac PMMS, week of August 13, 2026 (archived). No consensus forecast for July starts could be traced to a citable source, so no beat/miss framing appears here. Builds on the June starts read, the June new-home sales read, and the housing inventory divergence deep dive.
Correction
September 17, 2026 — Census has revised July’s single-family starts up to 853,000 from the 808,000 first reported, and total starts to 1.309 million from 1.239 million. On the revised series July is not the lowest single-family month since November 2022 — September 2025, at 837,000, was lower — and, against a June also revised up to 1.439 million, total starts fell 9.0% in July rather than 12.4%. July completions were revised to 1.280 million, the lowest since January 2022 rather than May 2020. The South still accounts for more than the whole annual decline in July’s total starts on the revised figures (−183,000 against −123,000). The figures above are the first estimates. The August note covers the revised data.