Summary of June JOLTS, August 4, 2026
- Job openings were little changed at 7.36 million (May revised down 57,000 to 7.54 million) — yet openings per unemployed worker rose to 1.04, the highest since January 2025.
- The ratio rose on its denominator: 213,000 fewer unemployed in a month when household employment fell 507,000 and the labor force shrank by 720,000.
- Churn is stuck below normal — quits at or below 2.0% for a twelfth month (2019 average: 2.3%), hires at 3.4%, layoffs at 1.1%. Low-hire, low-fire.
- No cut case from layoffs (1.1%), no hike case from demand; Friday’s July payrolls and the participation rate are the next test.
Job openings came in at 7.36 million in June — down 178,000 from a revised 7.54 million, a move BLS calls little changed; openings have run in a 6.9–7.6 million band all year (BLS JOLTS). The move that wasn’t little sat on the other side of the ratio. Job openings per unemployed worker — the measure the Fed cites for labor-market tightness — rose to 1.04, its highest since January 2025. With a statistically flat numerator, the arithmetic reconciles one way: the denominator fell faster.
Fewer unemployed, not more hires, moved the ratio
The unemployed count fell 213,000 in June, to 7.09 million — and not because those people found work. Household employment fell 507,000 the same month, and the labor force shrank by 720,000, with participation down 0.3 points to 61.5%, its lowest since March 2021 (BLS CPS; June jobs report). People didn’t move from unemployed to employed; they left the count entirely. Why, this release can’t say — JOLTS surveys job slots, not people; whether June’s leavers were retirees, discouraged job-seekers, or the shrinking foreign-born workforce is a question for the household detail tables that land with Friday’s jobs report. Payrolls grew just 57,000.
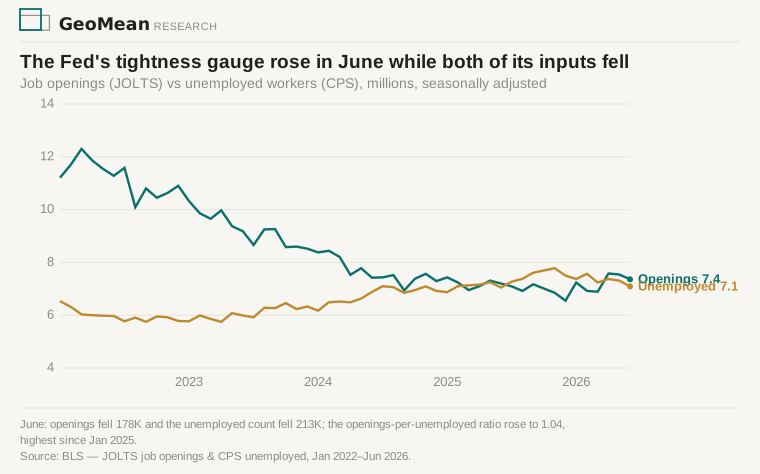
A gauge tightening because employers post more jobs is demand; a gauge tightening because workers stop looking is arithmetic. April, which started the ratio’s climb (0.95 in March to 1.03), was the first kind — an openings jump of nearly 700,000. June was the second: had the unemployed count held at May’s level, the ratio would have slipped to 1.01 instead of setting a 17-month high. This is the path David Cervantes (Pinebrook Capital) laid out in June — unemployment drifting toward 4% by year-end through a shrinking labor force rather than through hiring — and June’s data matched it: the rate fell to 4.2% while employment and participation both fell. One noisy month in his direction, not a verdict; Friday is the test.
Quits held at 2.0%, a twelfth month below normal
Underneath, workers still aren’t quitting and employers still aren’t firing. Quits held at 2.0% — a twelfth straight month at or below 2.0%, against a 2.3% average in 2019 (our archived series; last above 2.0%: June 2025). Hires ran 3.4% against 3.9% in 2019; layoffs held at 1.1%, still no firing wave. Hires minus total separations came to roughly zero (−3,000), consistent with a payroll month of +57,000: employers are neither adding nor shedding. (May’s hires, quits, and layoffs were all revised up in level; every rate held.)
The increases came in transportation, warehousing, and utilities (+97,000) — the sector whose producer prices, 13.9% year over year, are the hottest component in our June PPI decomposition, so postings and prices are rising in the same place — and in federal government (+39,000); wholesale trade (−74,000) and nondurable manufacturing (−55,000) gave openings back.
Friday’s payrolls test whether the labor-force exit continues
The release does little to move the Fed’s options. Layoffs at 1.1% make no case for a cut; flat-to-lower openings and below-normal quits make no case for the hike last week’s three dissenters wanted — they argued from the inflation level (core PCE at 3.3%, inflation), not from labor. But slack disappearing through exits behaves differently from slack absorbed by hiring: if participation keeps falling, the unemployment rate can keep falling while hiring stalls at +57,000 a month. Friday’s July report (consensus +80,000) — the participation rate above all — will show whether June’s exit was noise or the start of a trend. The next JOLTS lands September 1.
Sources: BLS Job Openings and Labor Turnover Survey, June 2026 (USDL-26-1289) — openings, hires, quits, layoffs, separations, levels and rates, pulled from the BLS API (series JTS000000000000000·JOL/JOR/HIL/HIR/QUL/QUR/LDL/LDR/TSL/TSR) and archived with this piece alongside the puller script. BLS CPS for the household side: unemployed (LNS13000000), employment (LNS12000000), labor force (LNS11000000), participation (LNS11300000). Builds on the June jobs read (Jul 3 weekly), the May JOLTS deep dive, and the June PPI. The October 2025 CPS observation is missing from the ratio series (the lapse in appropriations); the January 2025 comparison stands either side of the gap. Consensus figures are the market’s expectation, not an aggregator datum.