Summary of June New Residential Sales, July 24, 2026
- New single-family home sales ran at a 628,000 annual pace, up 1.6% from May — a change inside a ±14.8-point confidence interval (Census/HUD CB26-121, archived). The pace is 48,000 above what was published a month ago, but 38,000 of that arrived by revision: May was raised from 580,000 (original print) to 618,000.
- The West fell 22.4% (±19.0) to a 104,000 pace — the lowest month of the thirteen the release shows, and the only regional change whose interval excludes zero.
- The median price was $398,300 against a May median revised down to $412,000; the average fell 9.5% (±7.2) on the month — the report’s one statistically significant price move. The same month’s median existing home set a record $440,600 (NAR).
- For-sale inventory was 485,000 (little changed; 118,000 of it completed homes), a 9.3-month supply against a revised 9.4. The overhang is stable, not deepening.
New construction is the discount section of the housing market, and the discount is widening. A buyer in June paid about 10% less for the median new house than for the median existing one; a year ago the gap was about half that — June 2025’s new median of $409,200 sat roughly 5% below that month’s existing median. Builders carrying 485,000 unsold homes cut prices to move them; owners locked into pandemic-era mortgage rates decline to sell, so the resale market’s record median is set by the few transactions that still clear.
The level improved 48,000 — and 38,000 of it came by revision
June’s gain is measured against a May that no longer resembles the one reported last month: sales revised up 580,000→618,000, the median revised down $424,900→$412,000. The release’s own notes say preliminary sales estimates revise about 5.0% on average and four months are needed to establish a trend; the last four months read 659, 646, 618, 628 — a flat market, with every month-to-month change inside its interval.
The West fell 22.4%, the only significant regional move
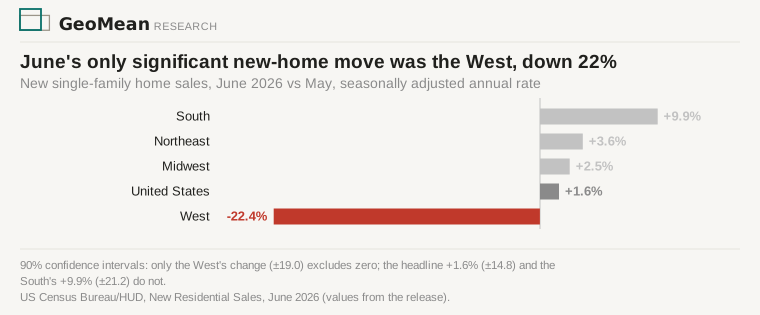
A 104,000-unit pace in the West is the weakest of the thirteen months in the release. Every other regional change — including the South’s +9.9% — sits inside its interval. The builder market’s geography still matches the resale map from the inventory divergence work: two-thirds of new-home sales are in the South, where unsold homes are concentrated; the starved Northeast takes 29,000 of 628,000 — under 5%.
The price cut is real, and mix explains only part of it
Part of June’s lower median is composition — the expensive West sold far fewer homes, and Census notes that price changes reflect shifts in what sold. But the one significant price fact cuts through the mix: the average sale fell 9.5% (±7.2) in a month. And the sellers’ positions differ in kind: 56% of June’s sales were completed homes — specs the builder is already carrying — while the resale record is set by owners who can simply wait (NAR’s June detail: sales rose only in the expensive Northeast, fell most in the cheaper South). Where sellers must sell, prices fall. Where sellers can wait, the record median describes who is still selling, not what houses are worth.
Sources
Census/HUD New Residential Sales, June 2026, CB26-121 (dated archive) — release PDF and table extractions also archived with this piece · May’s original 580,000 print (Calculated Risk) · NAR existing-home sales, June 2026 · Builds on the housing inventory divergence deep dive and the June housing-starts note.