Summary of June PPI, July 15, 2026
- Producer prices fell 0.3 percent in June against a consensus that looked for no change, and the 12-month rate eased to 5.5 percent from 6.0. Gasoline fell 12.0 percent, crude petroleum 12.1.
- Goods prices fell at all four production stages, the same oil-spike reversal June CPI showed. Services prices rose at all four.
- Producer core inflation held at 5.1 percent over the year, unchanged from May, against a consumer core of 2.6.
- Freight and exports are 19 percent of that core’s weight and 37 percent of its inflation. BLS’s consumer-only version of the same measure runs 4.8 percent, and 4.4 percent once freight comes out.
- May’s producer note called compressing distributor margins the buffer holding cost increases back from consumers. Margins are up 3.3 percent over the year. That call was wrong.
The Producer Price Index for final demand fell 0.3 percent in June, seasonally adjusted, against a consensus that looked for no change.
Gasoline fell 12 percent and took the headline number with it
The 12-month rate eased to 5.5 percent from 6.0, and final demand goods fell 1.4 percent — the largest monthly decline since July 2022. Energy fell 6.4, and BLS traces nearly two-thirds of the goods decline to gasoline, down 12.0 percent. Crude petroleum fell 12.1. Consumer gasoline fell 9.7 percent the same month.
The reversal is petroleum, not energy. Natural gas rose 16.6 percent.
Goods fell at every production stage, services rose at all four
Behind final demand, goods inputs fell at each of the four stages — down 0.2, 0.4, 3.6 and 1.3 percent, from the stage nearest the consumer back to the raw end. Unprocessed goods fell 4.1 percent, processed goods 1.2.
Services inputs rose at all four. Services for intermediate demand rose 0.3 percent, and its 12-month rate reached 5.0 percent — the highest since February 2023. BLS traces more than half of that increase to loan services, up 5.7 percent, and names securities brokerage next. Those prices move with credit and asset markets.
Producer core inflation held at 5.1 percent
Producer prices excluding foods, energy and trade margins rose 0.1 percent in June. Over 12 months they are up 5.1 percent, where they were in May, and their three-month rate is 6.0. Consumer core inflation is 2.6 percent over the year and 2.3 over three months. The headline prints moved together in June; the cores did not converge at all.
Freight alone is a fifth of producer core inflation
Transportation and warehousing is 7 percent of the producer core’s weight and 19 percent of its 12-month inflation, running 13.9 percent — freight priced off the fuel that just reversed, and it fell 0.1 percent in June. Exports add 12 percent of the weight and 18 percent of the inflation. Together they are under a fifth of that core and more than a third of its rate.
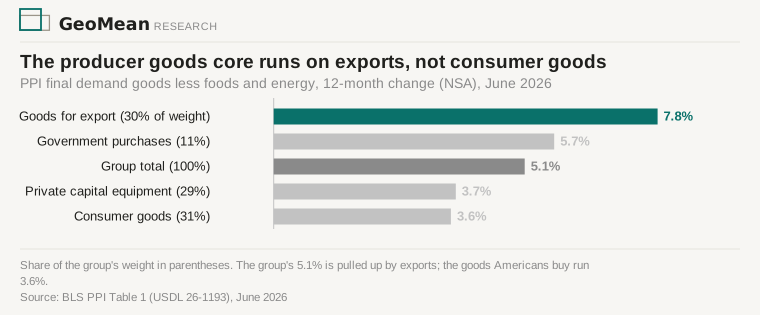
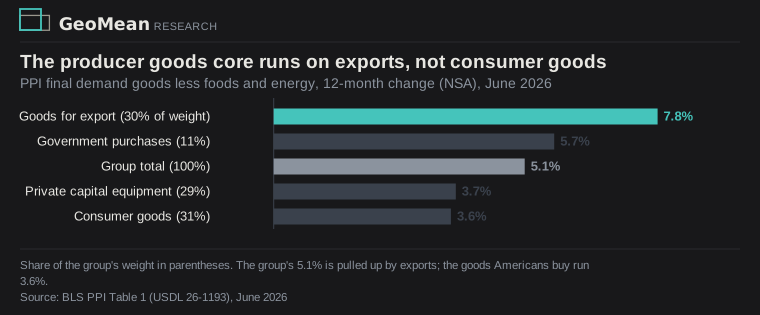
Even the consumer-only producer core runs 4.8 percent
Restrict the producer core to what households buy and it runs 4.8 percent; take freight and distribution out too and it runs 4.4. Both are BLS’s own published measures, and both sit above the 2.6 percent consumer core. The producer index cannot close the rest — it carries no shelter, while shelter is a third of consumer prices.
Distributor margins never were a buffer
May’s producer note argued that compressing distributor margins were absorbing the cost increase, and that their re-expansion would mark the month it reached consumers. This release revised May’s decline from 1.1 percent to 2.3; June’s margins then rose 0.4. Over 12 months margins are up 3.3 percent, and the index is flat against February. A series that swings two points a month and ends the shock where it started is not a buffer. That call was wrong.
June’s rise does not reverse it. BLS traces half the month’s services increase to fuels and lubricants retailing, up 13.0 percent — filling stations widening margins as wholesale gasoline fell.
Nothing in this release points at a faster consumer core. What kept the producer core at 5 percent is freight that has stopped rising, exports Americans do not buy, and fees that track asset markets.
Sources: BLS Producer Price Indexes — June 2026 (USDL 26-1193), the permanent archived copy, which carries the release text, Tables A–D and Table 1’s percent changes and relative-importance weights; the WPSFD/WPSID final-demand and intermediate-demand series via api.bls.gov. Consumer figures: BLS Consumer Price Index — June 2026 (USDL-26-1191). Companion: the June CPI deep dive. Verified figures, flat files, the weight decomposition and the chart spec are archived with this piece. Notes: February–May 2026 figures reflect this release’s revisions — May final demand is restated 1.1 to 0.6 percent, May’s 12-month rate 6.5 to 6.0, and May’s trade margins −1.1 to −2.3, superseding the figures in May’s producer note. Effective with June data, the PPI includes 22 resampled industries on 2022 NAICS.