Summary of May JOLTS, June 30, 2026
- Job openings held at 7.59 million — above the 7.28M the market looked for and barely changed from April. Labor demand did not crack.
- Nothing is moving: the quits rate (1.9%) sits below its 2.3% pre-pandemic norm, and hires (3.3%) are near a decade low outside COVID. Workers stay put; employers don’t add.
- But layoffs stayed low at 1.1% — no firing wave. This is a low-hire, low-fire market that normalized without a recession.
- For the Fed, this closes the labor-side case for a cut: with core PCE at 3.4% and no labor crack, there is no cover to ease.
Job openings held at 7.59 million in May — forecasters expected a fall to 7.28 million — and layoffs stayed historically low at 1.1% (BLS JOLTS; FRED JTSJOL). The vacancy-to-unemployed ratio the Fed watches for slack edged up to 1.04, near its pre-2020 level. The cooling that would force a rate cut isn’t in this print.
Hiring is stuck as low as quitting
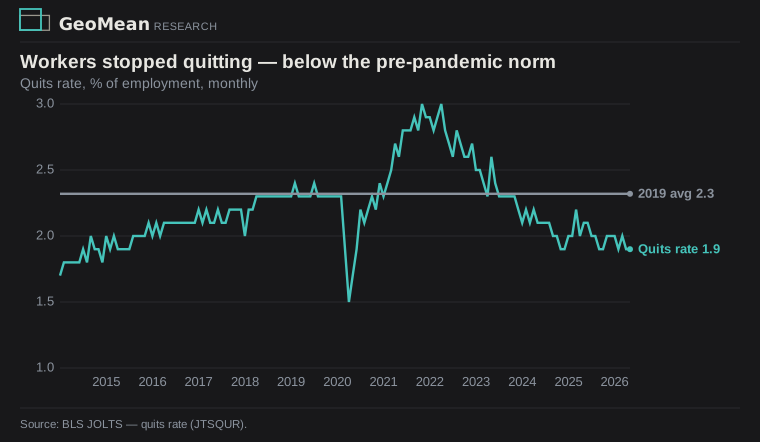
The signal is in the churn, and the churn isn’t moving. The quits rate held at 1.9% — beneath the ~2.3% that prevailed before the pandemic, and a world away from the 3.0% Great Resignation peak. Quits are voluntary: workers leave when they’re confident of a better job, so a quits rate below its pre-COVID norm means the opposite of a tight market.
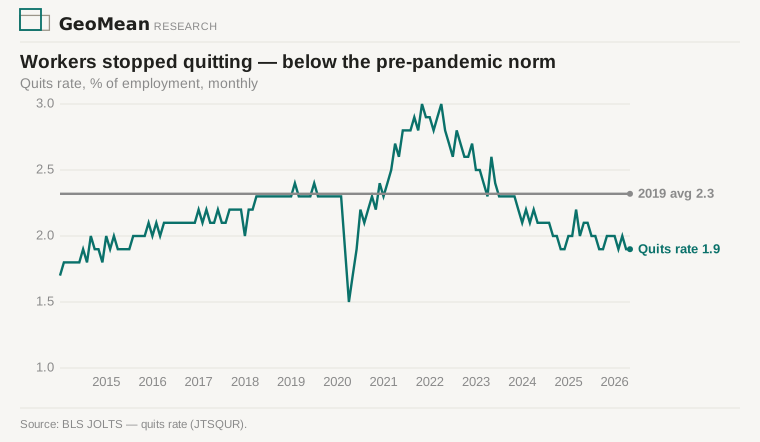
The hires rate shows the same pattern from the employer side — 3.3%, among the lowest readings since 2014 outside the COVID shock. But layoffs and discharges held at 1.1%, historically low. That is the defining shape of this labor market: low-hire, low-fire. Nobody is being hired and nobody is being let go. A steady openings level hides it — a stable market and a stuck one look identical on the headline, and only the separations detail tells them apart. (JOLTS is volatile and heavily revised, with a falling survey response rate; the frozen-churn pattern has held for many months, not one print.)
Vacancies normalized without unemployment rising
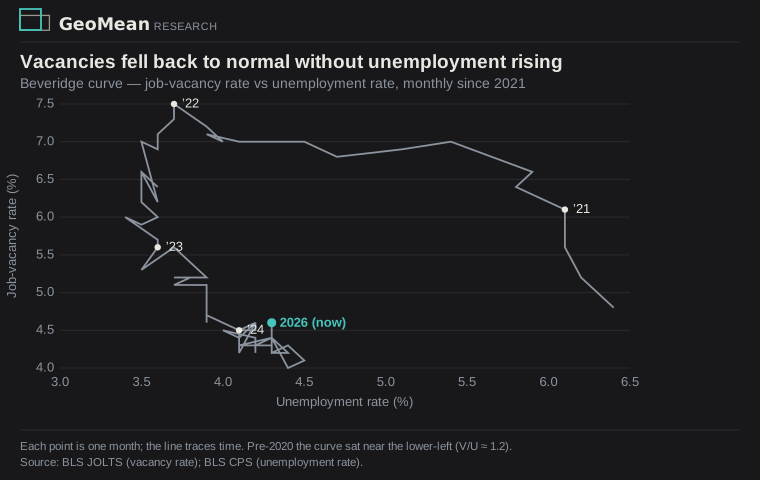
The vacancy-to-unemployed ratio has retraced almost its entire pandemic climb — from a 2.04 peak in 2022 to 1.04 now, near its pre-2020 level. The Beveridge curve shows how it got there: vacancies fell from a 7.5% rate at the 2022 tightness peak back to 4.6%, while unemployment rose only from 3.7% to 4.3%.
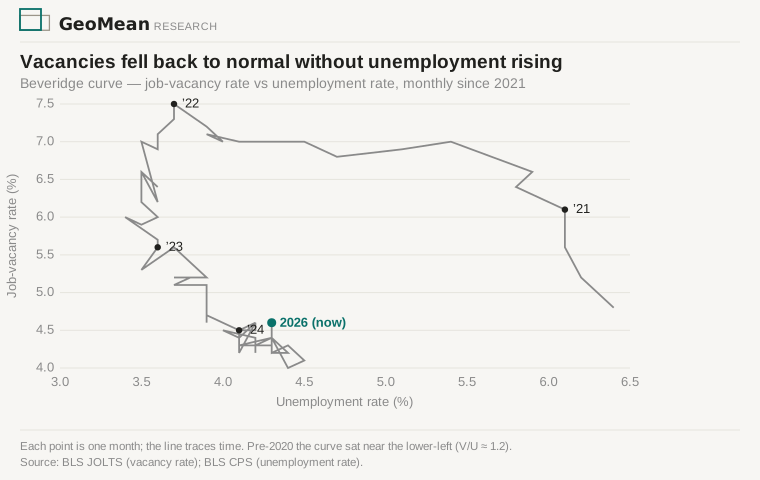
Falling vacancies that don’t spill into rising unemployment is the path the Fed argued was possible and most forecasters called unlikely — a labor market loosening by burning off excess job postings rather than shedding workers. As of May, it has done precisely that.
No labor cover for a cut
The case for a cut is in this very release: hires sit among their lowest since 2014, quits have fallen below their pre-pandemic norm, and a low-fire market can flip fast once layoffs turn. That is genuine demand-side weakness, and the steady openings headline masks it. But the evidence for an imminent crack isn’t here — layoffs held at 1.1%, and a labor market doesn’t break without firings. What May shows is a market that has stopped expanding, not one shedding workers.
Set that against a 3.4% core PCE and the conclusion is the one the PCE print already delivered: the Fed has no cover to cut. At a vacancy-to-unemployed ratio near 1.0 the cushion is gone too — further cooling now comes out of jobs, not unfilled postings — so the risk is real but forward, not in the May data. The soft spot to watch is the low quits rate: when few workers have a new job lined up, a stall in hiring turns into rising unemployment fast. Friday’s payrolls (Jul 2) are the next test of whether the freeze is starting to crack.
Sources: BLS Job Openings and Labor Turnover Survey, May 2026 — openings, hires, quits, layoffs, separations and their rates — via FRED (JTSJOL, JTSQUR, JTSHIR, JTSLDR, JTSJOR); BLS CPS unemployment (UNRATE, UNEMPLOY) for the vacancy-to-unemployed ratio and the Beveridge curve. Charts + data archived with this piece. Builds on the May PCE deep dive and the Jun 26 weekly. Consensus is the market’s expectation, not an aggregator datum.