Summary of May PCE, June 25, 2026
- Core PCE rose 0.3 percent in May to 3.4 percent over the year — the highest since October 2023. Headline hit 4.1 percent, topping 4 for the first time in three years.
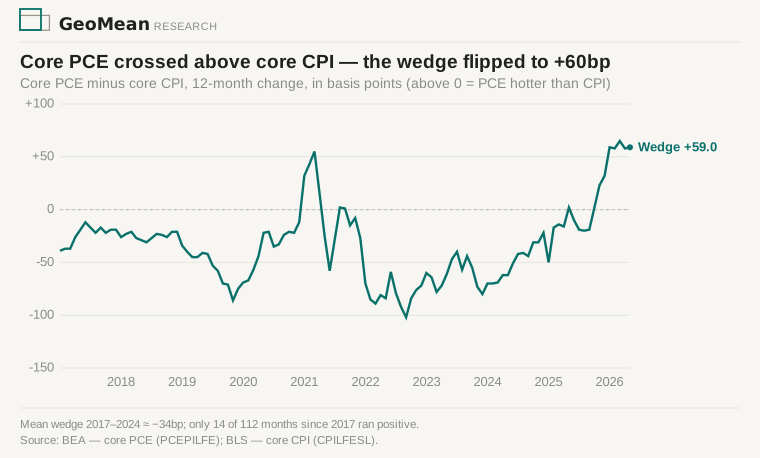
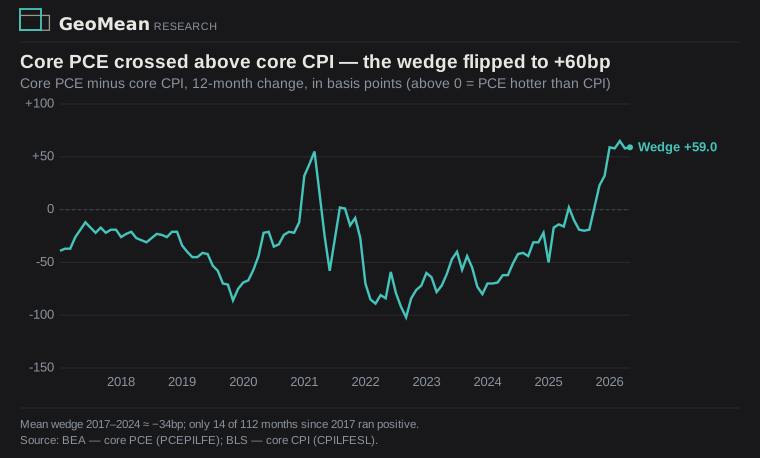
- Core PCE (3.4) printed above core CPI (2.9) — an inversion: PCE normally runs 0.3 to 0.5 point below CPI. The gap flipped by roughly a full point.
- The driver is the services PCE weights far more heavily than CPI does — health care and financial services, which PCE counts at employer- and government-paid scale that CPI’s out-of-pocket scope never captures.
- Spending was services-led (+$94.3 billion vs +$61.8 billion in goods) and real, not just price (real spending +0.3 percent), with the saving rate at 3.0 percent — no growth crack to justify a cut.
| May 2026, PCE | m/m (SA) | y/y |
|---|---|---|
| PCE price index | +0.4% | +4.1% (3-yr high) |
| Core PCE (ex food & energy) | +0.3% | +3.4% (highest since Oct 2023) |
| Core CPI (same month, for comparison) | +0.2% | +2.9% |
| Real disposable income | +0.3% (vs −0.5% Apr) | — |
| Real PCE (spending) | +0.3% (vs 0.0% Apr) | — |
| Personal saving rate | — | 3.0% |
The Personal Consumption Expenditures price index rose 0.4 percent in May, and the 12-month rate reached 4.1 percent — above 4 for the first time since 2023. Core PCE rose 0.3 percent, putting the annual core at 3.4 percent, the highest since October 2023. Both numbers came as the energy shock that drove the spring’s headline prints reversed: WTI fell about 10 percent to near $70 the same week, on the Strait of Hormuz reopening. Energy went away, and underlying inflation firmed anyway.
Core PCE crossed above core CPI — it almost never does
Two weeks ago, core CPI for May printed at 2.9 percent. Today core PCE printed at 3.4. That ordering is backwards. PCE normally runs 0.3 to 0.5 point below CPI — it lets the basket re-weight as consumers substitute, and it leans less on shelter. A core PCE above core CPI is the kind of inversion that shows up a handful of times in forty years. The wedge between the two gauges, historically around minus 30 to 40 basis points, has swung to roughly plus 60 — one of the largest reversals since the mid-1980s (PIMCO).
Weighting drives the inversion, and the weight is health care
The two indexes price the same economy with different baskets. PCE counts spending made on the consumer’s behalf — employer-paid insurance, Medicare, Medicaid — so its health-care weight runs about 16.8 percent against CPI’s 7 (BLS methodology). CPI’s weight goes instead to shelter, about 34 percent versus PCE’s 16. When the inflation sits in the services PCE over-weights — health care and financial services — PCE rises while CPI stays subdued. That is exactly what happened in May: the release’s own spending detail puts financial services and insurance (+$28.4 billion) and health care (+$22.3 billion) at the top of the May increase, ahead of every goods line. The categories driving the increase are the ones CPI barely counts.
Spending held, which removes the cut excuse
This was not a price-only print. Real PCE rose 0.3 percent after a flat April, real disposable income rose 0.3 after falling 0.5, and the saving rate held at 3.0 percent — consumers spending out of rising real income, not draining savings. Spending was services-led, +$94.3 billion against +$61.8 billion in goods. A Fed looking for a demand crack to justify cutting while headline inflation runs above 4 percent did not get one here.
A 3.4 core kills the disinflation case
The disinflation case rested on the energy shock unwinding into a quiet core. Energy unwound, and core went the other way — to 3.4. The June dot plot’s higher-rate projections (median 2026 marked up, inflation projection lifted toward 3.3 core) look less stale, not more, and the market now prices roughly 80 percent odds of zero 2026 cuts. The gauge the Fed actually targets just printed its highest core in two and a half years, with the inflation lodged in the services that don’t unwind when oil does.
Sources: BEA, Personal Income and Outlays, May 2026 (PDF) — all PCE figures, the spending-by-category detail, and the April–May comparison table (BEA Tables 2.6, 2.8.5, 2.8.7); core CPI via our May CPI deep dive and the BLS CPI release; the CPI–PCE wedge mechanism via the BLS PCE–CPI methodology paper and PIMCO macro analysis. Energy/oil via market data. PCE is revised each release; January–April figures reflect this release’s revisions.